Nick, a Group Product Manager on the Jira Software team, demos how to set up a simple automation rule. Thanks for watching and don't forget to subscribe to our channel
Ever use stickers or GIFs to make your texts, messages, or DMs more interesting? If yes, you’ve probably used Holler – a messaging tool that makes digital conversations come to life. The engineers at Holler have the daunting task of monitoring the performance and reliability of a service used by millions of people around the globe on a daily basis. Like many modern DevOps teams, they chose the ELK Stack to manage and analyze their log data. Hear from Daniel Seravalli, a Lead Engineer at Holler, on their story about grappling with the complexities of managing their ELK Stack at scale.
We try to automate as much as possible in our environments, but we often treat monitoring as an afterthought. In this episode of Stack Doctor, we show you how to automate your monitoring configurations via Terraform. Watch to learn how you can automate the creation of common resources - such as uptime checks, alerting policies, and dashboards - with Terraform!
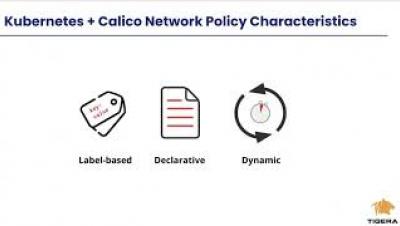
In this session, we will go over the core concepts in k8s network policies and calico network policies. Compare and contrast between the two models, and highlight when to use one versus the other.
Datadog offers a single unified platform to observe your infrastructure, applications, network flows, security threats, UX, and more. For full visibility, you can seamlessly navigate between metrics, traces, and logs. See inside any stack, any app, at any scale, anywhere.
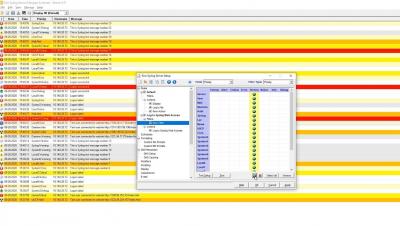
SolarWinds® Kiwi Syslog® Server is an affordable on-premises solution designed to help you manage syslog messages, SNMP traps, and Windows event logs. It centralizes and simplifies log message management across network devices and servers. Kiwi Syslog Server lets you collect, filter, alert, react to, and forward syslog messages and SNMP traps, and it helps you adhere to regulatory compliance. Learn how to simplify syslog and SNMP trap management with SolarWinds Kiwi Syslog Server.
In this episode of LogicTalks, Mark Banfield, Chief Revenue Officer at LogicMonitor, is joined by Ken Perry, Product Manager and Technology Monitoring Architect at Harvard University to discuss how LogicMonitor has shifted Harvard's monitoring strategy. Ken explains how LogicMonitor has helped to break down monitoring silos between departments, solve unique challenges and use cases within such a large organization, and how LogicMonitor aided Harvard in it's transition to remote learning during the COVID pandemic all while helping to build operational confidence throughout Harvard and it's leadership.
There are many causes of poor network performance. Some network problems can arise from fault hardware or from unexpected usage patterns. Experiencing a network problem is frustrating, and left unattended, it can be disastrous for your business network. That's why it's important to understand what can go wrong with your network and quickly identify and fix problems as soon as they arise. Now let's go through some of the network issues that have left many users pulling their hair out in frustration.