Operations | Monitoring | ITSM | DevOps | Cloud

Latest Videos

STIG hardening on Ubuntu 22.04 with Ubuntu Security Guide

In this webinar, Henry Coggill will showcase USG (the Ubuntu Security Guide) and demonstrate how it can automate compliance requirements. We will discuss the hardening profiles that are available, including DISA-STIG and CIS benchmarks, then cover setting up and configuring the tool and demonstrate the configuration options that you can make for maximum security and coverage of the STIG rules.

Achieving SLO Success with Golden Signals and Reliability Testing

The four Golden Signals are an easy and effective way to measure the most important aspects of a system, and when paired with a reliability management platform like Gremlin, they help you proactively meet your SLOs so you can meet your legal obligations and deliver the perfect customer experience.

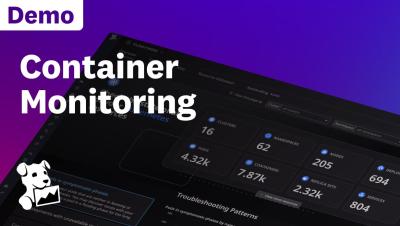
Container Monitoring Demo

Datadog Container Monitoring gives you real-time, end-to-end visibility into the health, security, and resource usage of your containerized environments. In this demo, we’ll show you how Datadog measures container health alongside security posture and resource utilization, offering end-to-end monitoring and optimization for your container ecosystem.

Everything You Need to Know Before Sending a Request For Proposal (RFP)

This video explains Request for Proposals (RFPs), a crucial business document for major purchases and projects. Learn with us: RFP purpose How organizations use RFPs Key components of an effective RFP Benefits for both buyers and suppliers Tips for creating and responding to RFPs.

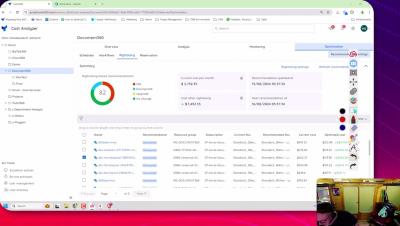
How to Send Rightsizing Recommendations to Azure DevOps - Expert insights

In this video, Michael Stephenson ( A FinOps certified practitioner & Azure MVP) will demonstrate on how you can identify Azure rightsizing recommendations using Turbo360 and then send them to Azure DevOps as a work item so that your team can implement the same in the next sprint. By integrating Turbo360 with Azure DevOps, you can streamline the rightsizing process, reduce manual effort, and ensure that your Azure resources are optimized for performance and cost.

Centralized Alert History in Grafana; GA in 11.2 | Grafana

With the centralized alert history page, you can view a history of all alert events generated by your Grafana-managed alert rules from one centralized page. This helps you see patterns in your alerts over time, observe trends, make predictions, and even debug alerts that might be firing too often. Grafana Cloud is the easiest way to get started with Grafana dashboards, metrics, logs, and traces.

Introducing State Timeline Pagination in Grafana 11.2 | Grafana

In 11.2, the state timeline visualization now supports pagination. Previously, all the series in a state timeline were made to fit within the single window of the panel, which could make it hard to read. The Page size option lets you paginate the state timeline visualization to limit how many series are visible at once. This is useful when you have many series.

Grafana Canvas Standardized Tooltips and Improved Datalinks in 11.2 (Demo) | Grafana

In 11.2, we've made standardized tooltips and data links improvements in canvas visualizations. These improvements are generally available. Watch the walk-through from Adela on the DataViz Squad at Grafana Labs. Grafana Cloud is the easiest way to get started with Grafana dashboards, metrics, logs, and traces.

11.2 Grafana Cloud Migration Assistant in Public Preview (Demo) | Grafana

In this video, Mitch, the Director of Product Management at Grafana, introduces the Cloud Migration Assistant, available in public preview in Grafana 11.2. This tool simplifies the process of migrating dashboards and data sources from Grafana Open Source or Enterprise to Grafana Cloud. Mitch demonstrates how users can easily transfer their configurations with a point-and-click UI, generate a token for secure connection, and use Private Data Source Connect to access private data sources.