Operations | Monitoring | ITSM | DevOps | Cloud

Latest News

User experience monitoring with Datadog browser tests

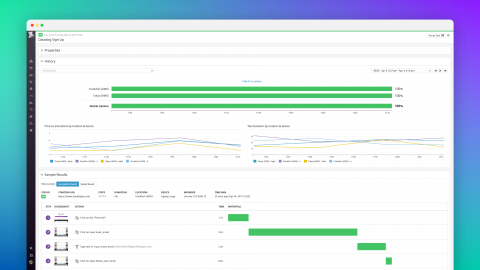
Datadog’s new automated browser tests enable you to automate your user experience monitoring and ensure that your users can complete actions like signing up for a new account or adding items to a cart. Anyone on your team can record and automate multistep browser tests in minutes. Once you create a test, Datadog uses machine learning to detect changes to your application and automatically update your tests accordingly.

Correlate request logs with traces automatically

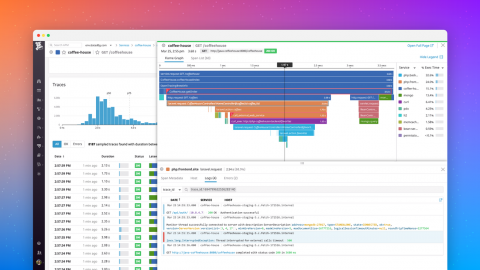
When your users are encountering errors or high latency in your application, drilling down to view the logs from a problematic request can reveal exactly what went wrong. By pulling together all the logs pertaining to a given request, you can see in rich detail how it was handled from beginning to end so you can quickly diagnose the issue.

Monitor AIX with the Datadog Unix Agent

Even in an era where container, serverless, and cloud-computing technologies garner considerable attention, many companies continue to run a sizeable share of their mission-critical applications on highly resilient, fault-tolerant systems such as IBM AIX on Power-series hardware. AIX, one of the most popular Unix-based operating systems, is trusted by large companies that process critical data such as medical health records and banking transactions.

How to Install the ELK Stack on AWS: A Step-By-Step Guide

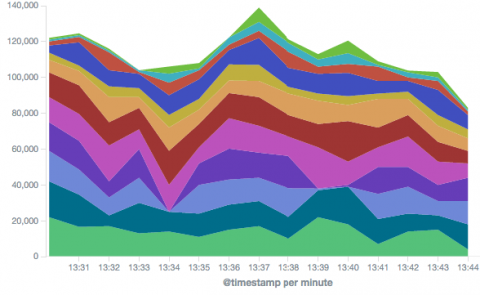
The ELK Stack is a great open-source stack for log aggregation and analytics. It stands for Elasticsearch (a NoSQL database and search server), Logstash (a log shipping and parsing service), and Kibana (a web interface that connects users with the Elasticsearch database and enables visualization and search options for system operation users). With a large open-source community, ELK has become quite popular, and it is a pleasure to work with.

Why Is Troubleshooting "Citrix is Slow" So Hard?

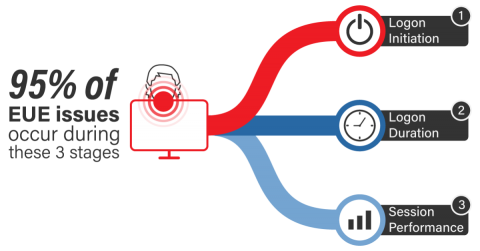
“Citrix is slow” is one of the most common complaints Citrix admins hear on a daily basis. Somewhat ironically, Citrix itself is rarely the problem and the actual cause of the Citrix slow performance issues lies elsewhere. This can make troubleshooting “Citrix is slow” issues extraordinarily difficult to do.

Best Practices for Efficient Log Management and Monitoring

When managing cloud-native applications, it’s essential to have end-to-end visibility into what’s happening at any given time. This is especially true because of the distributed and dynamic nature of cloud-native apps, which are often deployed using ephemeral technologies like containers and serverless functions.

Grafana Plugin Tutorial: Polystat Panel (Part 2)

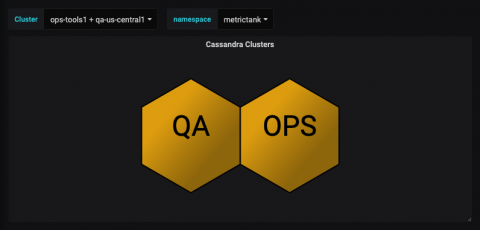
At the end of Part 1, the end result was a set of polygons that represented each Cassandra node in a Kubernetes statefulset. The cAdvisor-based metrics CPU/Memory/Disk utilization are scraped by Prometheus. This second tutorial will focus on a rollup of multiple Cassandra clusters running inside Kubernetes. We will end up with three dashboards tied together to provide an overview of our Cassandra clusters.