Operations | Monitoring | ITSM | DevOps | Cloud

Latest Blogs

Monitor AWS App Runner with Datadog

Knowing how to deploy and run applications has become a key part of modern app development, meaning that developers need expertise in a number of areas beyond their core application code. Whether it’s container orchestration, networking, scaling, or load balancing, there is a steep learning curve to being able to deploy and run an application at scale.

5 factors for evaluating an RMM tool for the modern MSP

Managed service providers (MSPs) are becoming increasingly important in the IT management industry. The role of an MSP does not just stop with monitoring, managing, and maintaining the IT services of their clients; it extends to keeping a close watch on everyday IT developments and proactively securing clients’ IT networks against cyberthreats. To balance all these responsibilities, MSPs need comprehensive IT management and monitoring solutions that can cater to all their needs.

Podcast: Break Things on Purpose | Jose Nino, Staff Software Engineer at Lyft

Get started with Gremlin's Chaos Engineering tools to safely, securely, and simply inject failure into your systems to find weaknesses before they cause customer-facing issues. Break Things on Purpose is a podcast for all-things Chaos Engineering. Check out our latest episode below. You can subscribe to Break Things on Purpose wherever you get your podcasts. If you have feedback about the show, find us on Twitter at @BTOPpod or shoot us a note at podcast@gremlin.com!

Enhanced Kubernetes right-sizing features for fine-tuned application efficiency

Spot by NetApp’s Ocean continuously optimizes Kubernetes clusters with a wide feature set tackling different aspects of running and managing Kubernetes containers in a cloud environment. To help users improve the efficiency and performance of their cloud environments, Ocean’s rightsizing capabilities provide recommendations that target over-provisioning and underutilization.

How Cloudflare Logs Provide Traffic, Performance, and Security Insights with Coralogix

Cloudflare secures and ensures the reliability of your external-facing resources such as websites, APIs, and applications. It protects your internal resources such as behind-the-firewall applications, teams, and devices. This post will show you how Coralogix can provide analytics and insights for your Cloudflare log data – including traffic, performance, and security insights.

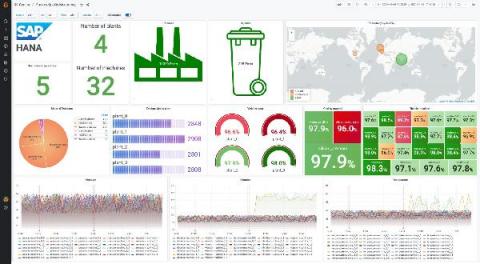
Monitor your production line with the new Grafana Enterprise data source plugin for SAP HANA

Greetings! This is Abdelkrim from the Solutions Engineering team, and I am with Sriram from the Enterprise Plugin team. We both joined Grafana Labs in February this year, and we already have some stories to share with you. I came to Grafana Labs from a big data and analytics background, and I witnessed a lot of companies storing monitoring and performance data in all kinds of analytics platforms (data lakes, data warehouses, cloud, etc.).

Measuring Success with Sentry

In the early days of web development, there was one way to measure code: WTFs per minute. It was a metric that could be applied across all languages, as every developer knew what WTF meant (Works That Frustrate, obviously). Today, however, code is too intricate — and important — for clever, opaque metrics. You need objective data that communicates the quality and stability of your code — KPIs such as events accepted, transaction outcomes, and crash-free sessions.

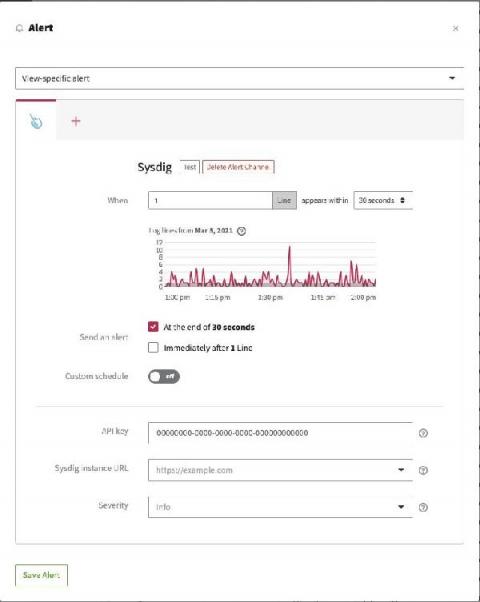
See your logs and metrics together with LogDNA and Sysdig integration

Observability is the key to solving problems quickly, and organizations use many tools to try to increase visibility in their environments so they don’t miss anything. Typical sources of observability include metrics, logs, and traces. The foundation of monitoring, metrics are predictable counts or measurements that are aggregated over a specific period of time. Timestamped records of discrete events that can store outputs from applications, systems, and services.