Operations | Monitoring | ITSM | DevOps | Cloud

What's new in Grafana Enterprise Metrics 1.4: Cross-cluster query federation and self-monitoring

We introduced Grafana Enterprise Metrics (GEM) last September to give centralized observability teams the ability to provide a multi-tenanted, horizontally scalable Prometheus-as-a-Service experience for their end users. Since then, we’ve continued to make improvements and introduce new functionality. In this blog, I wanted to take a deeper dive into two of the exciting new features released with GEM 1.4.

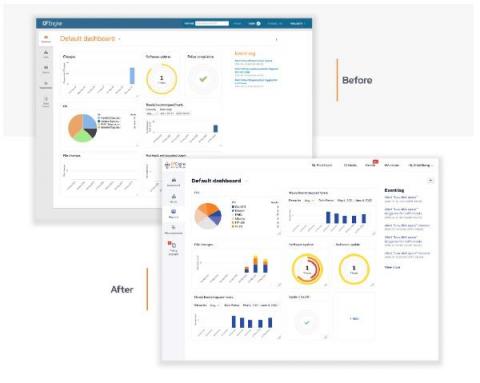
Updates to ServiceDesk Plus Cloud for Microsoft Teams: Enhanced chatbot, ESM, and UI

2020 has seen a surge in the number of organizations embracing remote work to adapt to the new normal, leading to increased reliance on digital collaborative workspaces like Microsoft Teams. As organizations migrate critical business processes to such digital workspaces, IT service management teams need to leverage these platforms as channels for delivering IT and enterprise support.

What's new in Calico Enterprise 3.7: eBPF data plane, high availability, and more!

As our enterprise customers build out large, multi-cluster Kubernetes environments, they are encountering an entirely new set of complex security, observability, and networking challenges, requiring solutions that operate at scale and can be deployed both on-premises and across multiple clouds. New features in our latest release add to the already formidable capabilities of Calico Enterprise.

July 2021 Update: Users can be members of multiple teams

The time has come! Users in SIGNL4 can now be a member of multiple teams. This allows for staff to be on duty in multiple groups or departments in parallel and to receive related alert notifications for incidents that occur in the different teams. In addition, you can now also send Signls to multiple teams. All details are available in this article.

What's new in Grafana Cloud for July 2021: Traces, live streaming, Kubernetes and Docker integrations, and more

If you’re not already familiar with it, Grafana Cloud is the easiest way to get started observing metrics (Prometheus and Graphite), logs (Grafana Loki), traces (Grafana Tempo), and dashboards. Here are the latest features you should know about!

Upgrade Alert: Test Your Internal Infrastructure with Enhanced Private Location Monitoring

External servers need to be monitored but it’s your backend infrastructure that supports them. Looking for a reliable way to monitor your internal networks? You’re in luck! Uptime.com Private Location monitoring is just the tool for you.

Cut cloud cost spending with a tool that works

More and more, we see our clients moving their workloads from clunky on-premise data centers to nimble cloud platforms, orchestrated container environments, such as Kubernetes and Red Hat OpenShift, or a combination of both. The technical aspects of such a migration are typically well-known. Your IT staff does a great job managing these environments: Still, there is one more aspect of managing these environments that is often overlooked — cost.