The latest News and Information on Monitoring for Websites, Applications, APIs, Infrastructure, and other technologies.
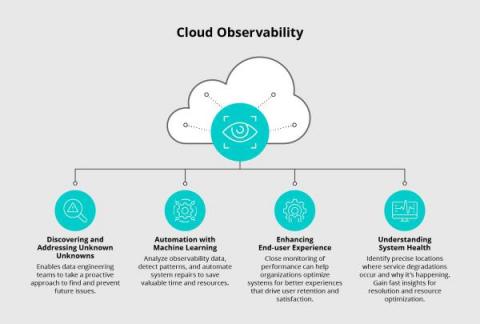
A robust observability strategy forms the backbone of a successful cloud environment. By understanding cloud observability and its benefits, businesses gain the ability to closely monitor and comprehend the health and performance of various systems, applications, and services in use. This becomes particularly critical in the context of cloud computing. The resources and services are hosted in the cloud and accessed through different tools and interfaces.
IDC published a Market Perspective report discussing implementations to leverage Generative AI. The report calls out the Elastic AI Assistant, its value, and the functionality it provides. Of the various AI Assistants launched across the industry, many of them have not been made available to the broader practitioner ecosystem and therefore have not been tested. With Elastic AI Assistant, we’ve scaled out of that trend to provide working capabilities now.
Businesses are increasingly turning to cloud computing to drive innovation, scalability, and cost efficiencies. For many, managing cloud costs becomes a complex and daunting task, especially as organizations scale their cloud infrastructure and workloads. In turn, cloud cost management tools can help teams gain better visibility, control, and cost optimization of their cloud spending. These tools not only provide comprehensive solutions to track and analyze, they also optimize cloud expenses.
#Shorts Tired of the new Google Analytics interface? Frustrated with building reports from scratch? Join me as I introduce Request Metrics, a game-changing analytics tool that provides ready-made answers without the headache of DIY reports. Say goodbye to the analytics struggle and hello to simplified data analysis.
This article will outline what Redis database monitoring is and how to set up a Redis database monitoring system with MetricFire. Then we’ll show what the final graphs and dashboards look like when displayed on Grafana. We will be using Prometheus and Grafana to power the monitoring, and we'll use a simulated Redis DB to generate the data for the Grafana dashboards.
In recent years, employees have grown increasingly accustomed to the untethered connectivity of Wi-Fi. For many, the days of having a computer tethered to an ethernet cable can seem like a distant memory. That was true when employees were working in an office, and it is all the more the case as we’ve moved to a hybrid work world.
Managing containerized applications efficiently in the dynamic realm of Kubernetes is essential for smooth deployments and optimal performance. Kubernetes empowers us with powerful orchestration capabilities, enabling seamless scaling and deployment of applications. However, in real-world scenarios, there are situations that necessitate the restarting of Pods, whether to apply configuration changes, recover from failures, or address misbehaving applications.