IT analytics in 90 seconds: Tracking projects using burndown charts
Track work that's yet to be completed, and predict when your project will be finished using the Project Burndown report in Analytics Plus.


Microsoft Azure has long proven it’s a force to consider in the world of cloud computing. Over the past year, Azure has made some significant steps in bridging the gap with AWS by offering new services and capabilities as well as competitive pricing.
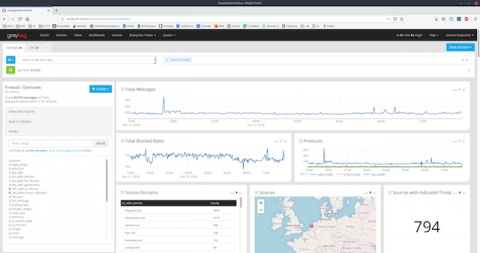
Today we are releasing the first release candidate of Graylog v3.0. This release brings a whole new content pack system, an overhauled collector sidecar, reporting capabilities, improved alerting with greater flexibility, a new script alert notification plugin, support for Elasticsearch 6.x, a preview version of an awesome new search page called Views, and tons of other improvements and bug fixes.
DevOps, Observability, Continuous Delivery, Test in Production, Chaos Engineering, and Software Ownership are all major themes in software development today, but why? In an ideal world, we get everything right the first time, nothing breaks, no one DDOS’ us, and the weather report is “Cloudy With A Chance of Meatballs.” Reality of course is different – and better, to be honest.
Back in the days of the wild wild web (www) and post JQuery era, one web framework stood above all others: AngularJS. A “ring to rule them all”, AngularJS consolidated quite a few micro-frameworks and provided many extensibility points of expansion if needed. Over time though, many performance and architectural questions began to arise, to the point of no return – when the guys @Google decided to migrate from AngularJS to Angular (a poor naming decision).
When developing PHP applications, error logs are under-used because of their apparent complexity. PHP error logs are helpful, especially when configured and used properly. While there are advanced tricks to truly squeeze every last drop of utility out of error logs, this article will cover the basics of configuration and the most common use cases so you can get up and running quickly.
We’ve added more info on the upcoming talks at GrafanaCon LA and are excited to see the schedule shaping up. Grab your ticket while the last and join us February 25-26 for two days of great talks and hands-on workshops. This week we’re happy to share articles on how to view Azure Monitor Log Analytics data in Grafana, a proof of concept to visualize Fitbit data, how to quickly get up and running with Prometheus and more.
Gaining visibility into modern IT environments is a challenge that an increasing number of organizations are finding difficult to overcome. Yes–the advent of cloud computing and virtually “unlimited” storage has made it much easier to solve some of the traditional challenges involved in gaining visibility. However, architecture has evolved into microservices, containers and scheduling infrastructure.
An immeasurable amount of data, in its raw, unfiltered form, exists all around us. For most of us, to be able to properly categorize and “read” that data, we first must convert it into a format that we can understand – which is where the log viewer comes in.