Operations | Monitoring | ITSM | DevOps | Cloud

The latest News and Information on Monitoring for Websites, Applications, APIs, Infrastructure, and other technologies.

Sponsored Post

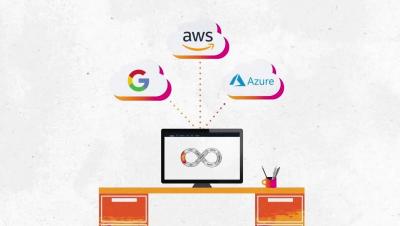
Supporting Remote Workers During a Pandemic

Working from home is no longer an option but a necessity. Millions of Americans are now part of this "work from home" experiment triggered by Covid-19. There may be no turning back as employees and businesses choose this new emerging model. Remote workers are likely here to stay. According to a Gartner 2020 survey, 82% of business leaders surveyed plan to allow their employees to work remotely for part of the time and half of them intend to allow their employees to work remotely in the future.

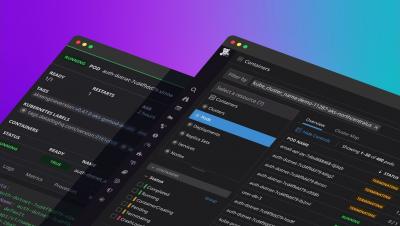
Datadog Live Containers - Kubernetes Resources

Datadog Live Containers provides multidimensional, real-time visibility into Kubernetes workloads, from Deployments and ReplicaSets down to individual Containers. Using Datadog's curated metrics, teams can track the health and performance of their Kubernetes resources in the appropriate context and surface critical information about every layer of their Cluster.

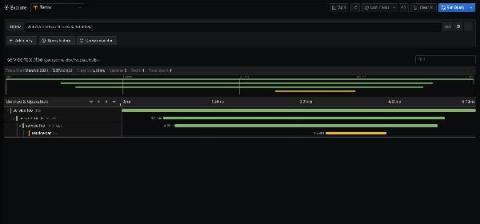
Get started with distributed tracing and Grafana Tempo using foobar, a demo written in Python

Daniel is a Site Reliability Engineer at k6.io. He’s especially interested in observability, distributed systems, and open source. During his free time, he helps maintain Grafana Tempo, an easy-to-use, high-scale distributed tracing backend. Distributed tracing is a way to track the path of requests through the application. It’s especially useful when you’re working on a microservice architecture.

Splunk Observability Cloud: Cutting through the complexity of modern applications

As infrastructure modernizes, it becomes more complex and more difficult to monitor and operate. To truly understand what your systems are doing, you need full-stack, end-to-end observability. We built Splunk Observability Cloud to eliminate your blind spots and go from alert to problem resolution in seconds–not hours. Splunk Observability Cloud provides one unified experience for seamless monitoring, troubleshooting, and resolution across any stack, at any scale.

Splunk Log Observer: Log analysis built for DevOps

Log analysis is a key part of getting answers from your stack, and Splunk Log Observer, part of the Splunk Observability Cloud, is built for fast, powerful log analysis. Trust the industry-leading expert on logs to help you draw insights fast from any volume of data, in real-time, without having to write any queries by hand.

Splunk Digital Experience Monitoring: Real insights into real user experience

Great user experience and web performance are essential for modern applications. Time spent waiting leads customers to leave. To keep users happy and revenue flowing, you need to know what's happening from the user's perspective. Splunk Digital Experience Monitoring (RUM & Synthetics) helps you see how your users really experience your site. As part of Splunk Observability Cloud, Digital Experience Monitoring gives you an end-to-end look at how your application is performing.

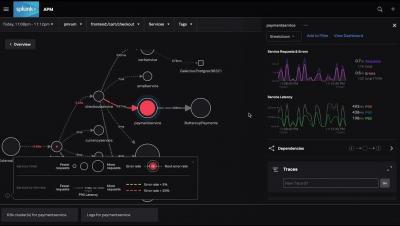
Splunk APM maximizes performance by seeing everything in your application.

Innovate faster in the cloud and elevate your user experiences with Splunk APM. Built for the cloud-native enterprise, Splunk APM uses all your data in NoSample^TM^ full fidelity for you to act on your data in seconds. Free your code and future-proof your applications today with Splunk APM. Get a free trial as part of Splunk Observability Cloud today.

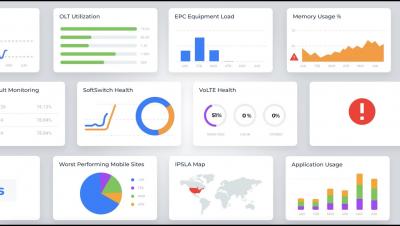
Anodot Helps CSPs Jump-Start Zero-Touch Network Monitoring

Anodot’s autonomous network monitoring platform provides the ability to monitor cross-layer network performance and service experience in one platform. We collect all data types, at any scale, and use AI/ML to correlate anomalies across the entire telco stack. Our platform is the "brain" on top of the OSS that detects service-impacting incidents in real time. We help customers like T-Mobile and Megafon protect their revenue and improve service experience - reducing the number of alerts by 90% and shortening Time-to-Resolve incidents by 30%.