The latest News and Information on Monitoring for Websites, Applications, APIs, Infrastructure, and other technologies.
Synthetic monitoring can be one of the most powerful tools in your DevOps team’s toolkit, especially for the SRE, yet is one that is often overlooked by people building out a reliability mindset. Synthetic monitoring permits you to simulate any transaction or interaction users can have in your website or app, from places around the world, as often as you’d like.
Thanks to the power of open source tooling and cloud services, shipping an application to production has never been that easy, In this blog post, we are going to go from bootstrapping a Next.js application to deploying it on Vercel. We will use Github Action to handle the Continuous Integration and Sentry to monitor the application once it is deployed to be warned of any problems as soon as it arrives.
When building alerts, engineers aim to create accurate, timely, and actionable alerts. In pursuit of this goal, many engineers will leverage PromQL throughout their careers. PromQL is the query language used by Prometheus and Alert Manager to query metrics and define alerting rules. While PromQL works very well for simple use cases, as infrastructure scales, architectural patterns grow more complex, engineering practices accelerate, and alerting use cases become more multivariate.
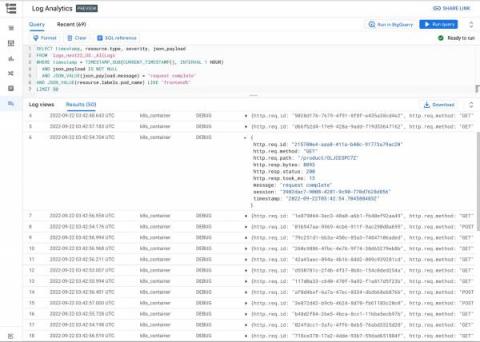
Logging is a critical part of the software development lifecycle allowing developers to debug their apps, DevOps/SRE teams to troubleshoot issues, and security admins to analyze access. Cloud Logging provides a powerful pipeline to reliably ingest logs at scale and quickly find your logs. Today, we’re pleased to announce Log Analytics, a new set of features in Cloud Logging available in Preview, powered by BigQuery that allows you to gain even more insights and value from your logs.
Armin Müller is the co-founder of ScopeSET. ScopeSET specializes in R&D work to build and integrate tools in the model-based systems engineering domain, with a track record of more than 15 years of delivering innovative solutions for ESA and the aerospace industry. Training machine learning models takes a lot of time, so we’re always looking for ways to accelerate the process at ScopeSET. We use open source components to build research and development tools for technical companies.
We recently broadcast a webinar to discuss DDoS trends and developments. Our partner Cloudflare had their cybersecurity evangelist, Ameet Naik, join us along with our own Doug Madory, head of internet analysis. I had the pleasure of moderating the discussion.
Complex, distributed software systems are chatty things. Because there are many components interoperating amongst themselves and with things outside their bounds like users, those components and the systems themselves emit many information signals. It’s the goal of monitoring, logging, and observability (o11y) tools to help the systems’ “stewards,” those developers and operators tasked with maintaining and supporting them, make sense of those signals.
This article is the final installment in a series that demystifies observability. The first three focused on the history of observability, dispelling myths around observability, and what observability is and what it can offer. In this last article of the series (Check out part 1), I want to offer a complete definition of observability.