Operations | Monitoring | ITSM | DevOps | Cloud

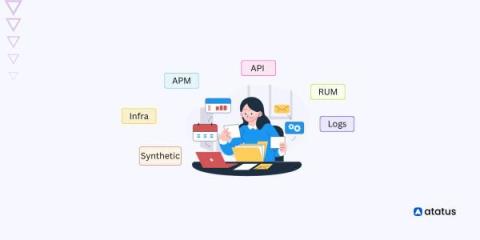
The latest News and Information on Monitoring for Websites, Applications, APIs, Infrastructure, and other technologies.

Choosing the Right Observability Tools for Developers

This is the third and final blog post in a series about shifting Observability left. If you have not yet read the first two, you can find the first post here and the second post here. Observability is fundamental to modern software development, enabling developers to gain deep insights into their application’s behavior and performance.


Observability vs. APM: What to Know on Your Monitoring Journey

In the ever-evolving landscape of software development and IT operations, monitoring tools play a pivotal role in ensuring the performance, reliability, and availability of your applications. Two key disciplines in this domain are observability and Application Performance Management (APM). This post will help you understand the nuances between observability and APM, exploring their unique characteristics, similarities, benefits and differences.

How to deploy Grafana Beyla on Kubernetes as a sidecar container

Principal Staff Engineer Nikola Grčevski demonstrates how to deploy Grafana Beyla on Kubernetes as a sidecar container. Grafana Beyla is an eBPF auto-instrumentation tool for application observability: you just have to tell it what to listen to, give it permissions, and deploy it-- and you can see metrics and logs from that component or service without having to do any manual instrumentation.

Unified Observability: The Right Way Ahead

Observability, in modern software engineering, has evolved into a paramount concept, shedding light on the intricate inner workings of complex systems. Three essential pillars support this quest for clarity: logging, traces, and metrics. These interconnected elements collectively form the backbone of observability, enabling us to understand our software as never before. Think of a system as a bustling city.

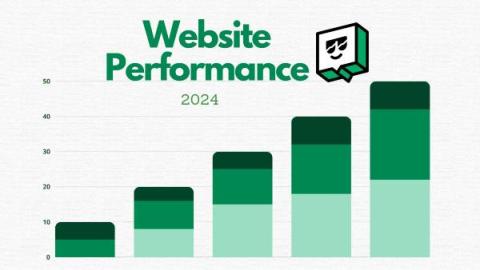
How Your Website's Performance Can Skyrocket Your Conversion Rates

Welcome to the Uptime.com Blog, where we turn website woes into wins! You’re diving into the fascinating world of website monitoring, and guess what? It’s going to be a game-changer for your site’s conversion rates. Let’s get you up to speed — and we mean that literally!

Enhance Employee Engagement with Parametric Campaigns

In today's digital workplace, IT-employee engagement is crucial for communicating timely information, fixing issues collaboratively, and understanding employees’ experience with technology. At Nexthink, we have met this evolving need with our investments in engagement campaigns. And now, we are pleased to introduce the newest innovation to connect IT and employees: parametric campaigns.

101 Guide to RabbitMQ Metrics Monitoring

This guide covers key metrics important for efficiently monitoring RabbitMQ. We will also talk about in-built RabbitMQ monitoring tools with which you can start monitoring your RabbitMQ instances. In fast-paced, data-driven applications where our data flows between the systems at lightning speed - the reliability and efficiency of your messaging infrastructure can make or break your whole application.
Sponsored Post

Improving API error responses with the Result pattern

In the expanding world of APIs, meaningful error responses can be just as important as well-structured success responses. In this post, I'll take you through some of the different options for creating responses that I've encountered during my time working at Raygun. We'll go over the pros and cons of some common options, and end with what I consider to be one of the best choices when it comes to API design, the Result Pattern. This pattern can lead to an API that will cleanly handle error states and easily allow for consistent future endpoint development.