Operations | Monitoring | ITSM | DevOps | Cloud
DevOps
The latest News and Information on DevOps, CI/CD, Automation and related technologies.
AKS Day 2 management made easy
Enable and use GKE Control plane logs
Low Disk Space Remediation: Triaging the Explosion of Data and Closing the Loop
Today, there is an explosion of data in IT. This data explosion of critical infrastructure living in the cloud, on premises in the data center, or even orchestrated in containers can be subjected to low disk space issues. How do you respond to the challenging inconvenience of low disk space?
THIS is what developer toil means!
Are you ready for DORA?
Not to be confused with the popular children’s TV character, DORA is a new EU regulation for the financial sector, which stands for the Digital Operational Resilience Act. DORA became law on 16 January 2023 and will start to apply from 17 January 2025, so it’s crucial that senior executives in the financial sector, such as Chief Risk Officers and Chief Information Security Officers, understand its implications and prepare for compliance from day one.
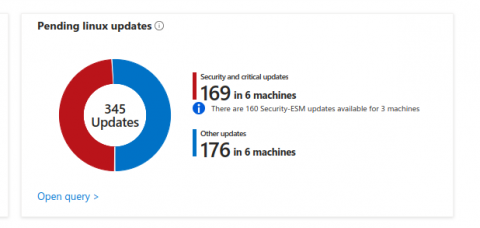
Enhancing the Ubuntu Experience on Azure: Introducing Ubuntu Pro Updates Awareness
Prometheus Monitoring 101
Prometheus is an increasingly popular tool in the world of SREs and operational monitoring. Based on ideas from Google’s internal monitoring service (Borgmon), and with native support from services like Docker and Kubernetes, Prometheus is designed for a cloud-based, containerized world. As a result, it’s quite different from existing services like Graphite. Starting out, it can be tricky to know where to begin with the official Prometheus docs and the wave of recent Prom content.
The Essentials of Cloud Package Management
Discover the importance of package management in software development and how Cloudsmith, a cloud-native artifact management platform, can streamline your DevOps processes. Learn about the key benefits of using Cloudsmith for package management, from control and visibility to security and speed.
Connecting Prometheus and Grafana
Using Prometheus and Grafana together is a great combination of tools for monitoring an infrastructure. In this article, we will discuss how Prometheus can be connected with Grafana and what makes Prometheus different from the rest of the tools in the market. MetricFire's product, Hosted Graphite, runs Graphite (a Prometheus alternative) with Grafana dashboards for you so you can have the reliability and ease of use that is hard to get while doing it in-house.


