Operations | Monitoring | ITSM | DevOps | Cloud

The latest News and Information on DevOps, CI/CD, Automation and related technologies.

Where does the tech sector go in 2021?

Like every industry sector, 2020 has been a tough year in tech. The pandemic has changed the way we work, it’s changed the way our customers work, and it’s been a rollercoaster ride. In August 2020, IDC’s Global ICT Spending Forecast 2020 – 2023 predicted 2020 revenue in the sector would fall to $4.8 trillion compared to its original estimate of $5.2 trillion.

Install JFrog Platform on Kubernetes in Under 20 Minutes

We get it, installing Artifactory and the JFrog DevOps Platform on Kubernetes can be daunting. As easy as we’ve sought to make it with our official JFrog installation Helm charts, there are a lot of decisions to be made. That’s meant to give you the widest possible choice for how to best fit your JFrog installation to your infrastructure. But choice can be overwhelming, too.

Where is Your Next Release Bottleneck?

A typical modern DevOps pipeline includes eight major stages, and unfortunately, a release bottleneck can appear at any point: These may slow down productivity and limit a company’s ability to progress. This could damage their reputation, especially if a bug fix needs to be immediately deployed into production. This article will cover three key ways using data gathered from your DevOps pipeline can help you find and alleviate bottlenecks in your DevOps pipeline.

10 Elasticsearch Configurations You Have to Get Right

Elasticsearch is an open source, distributed document store and search engine that stores and retrieves data structures. As a distributed tool, Elasticsearch is highly scalable and offers advanced search capabilities. All of this adds up to a tool which can support a multitude of critical business needs and use cases. To follow are ten of the key Elasticsearch configurations are the most critical to get right when setting up and running your instance.

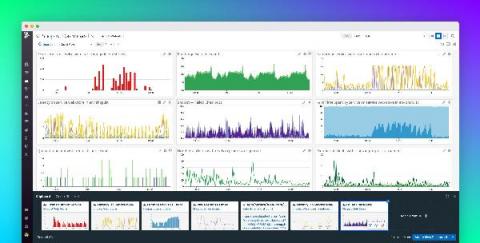
Explore your data effortlessly with the Datadog Clipboard

When investigating a complex system—or learning about it for the first time—you need to explore metrics, traces, logs, and other kinds of data. But as you navigate across different views of your data in dashboards, alert notifications, flame graphs, and so on, it can be hard to keep track of what you have already seen. When a potential issue comes up and time is tight, the last thing you need is to spend time remembering a crucial graph or finding the right browser tab.

End-to-end application monitoring with Datadog

For complete visibility into the performance of your applications, you need telemetry data—traces, metrics, and logs—that describes activity across your entire stack. But if you’re using multiple monitoring tools, your data can end up in silos, making it difficult to troubleshoot issues that affect your user experience.

What Gartner Gets Right About Cloud Cost Optimization (and Where They Miss)

Earlier this year, Gartner published “How to Manage and Optimize Costs of Public Cloud IaaS and PaaS,” by analysts Marco Meinardi and Traverse Clayton. As a company that is focused on enabling engineering teams with cloud cost intelligence, we were of course curious what they had to say. Now, if you are familiar with Gartner, you know they have a reputation for serving enterprise clients, so they can sometimes be — well, enterprisey.