The latest News and Information on DevOps, CI/CD, Automation and related technologies.
A Key Management Service (KMS) is used to create and manage cryptographic keys and control their usage across various platforms and applications. If you are an AWS user, you must have heard of or used its managed Key Management Service called AWS KMS. This service allows users to manage keys across AWS services and hosted applications in a secure way.
This is the first post of a 2 part series where we will set up production-grade Kubernetes logging for applications deployed in the cluster and the cluster itself. We will be using Elasticsearch as the logging backend for this. The Elasticsearch setup will be extremely scalable and fault-tolerant.
In this tutorial, we will learn about configuring Filebeat to run as a DaemonSet in our Kubernetes cluster in order to ship logs to the Elasticsearch backend. We are using Filebeat instead of FluentD or FluentBit because it is an extremely lightweight utility and has a first-class support for Kubernetes. It is best for production-level setups. This blog post is the second in a two-part series. The first post runs through the deployment architecture for the nodes and deploying Kibana and ES-HQ.
AI is booming. The AI market is projected to grow 37.3% annually from 2023 to 2030. With so many organizations adopting or considering AI applications, data centers need to be ready to support the new demand. However, without the right tools and data, it is difficult to understand if your existing facilities have the capacity to support systems like the “gold standard for AI infrastructure,” the NVIDIA DGX H100.
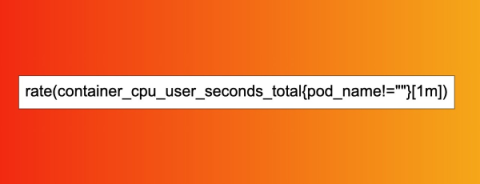
This article will focus on the popular monitoring tool Prometheus, and how to use PromQL. Prometheus uses Golang and allows simultaneous monitoring of many services and systems. In order to enable better monitoring of these multi-component systems, Prometheus has strong built-in data storage and tagging functionalities. To use PromQL to query these metrics you need to understand the architecture of data storage in Prometheus, and how the metric naming and tagging works.
The need to monitor the health of servers and networks is unanimous. You don't want to be a blind pilot who is headed for an inevitable disaster. Fortunately, there are many open source and commercial tools to help you do the monitoring. As always, good and expensive are not as attractive as good and cheap. So, we've put together the most valuable cloud and windows monitoring tools to get you started.
We kicked off the start of the Day 2 with our host Nigel Poulton as he prepared us with a quick rundown of the highlights from the first day before giving attendees a taste of what to expect from the rest of the event. After this point, Nigel brought Kelsey Hightower to the stage for his keynote session with Mark Boost and Dinesh Majrekar. If you missed our Day 1 recap, check it out here.