Dashboards

Grafana reporting: How we improved the UX in Grafana

Behind every feature in Grafana, no matter how big or small, lies a lot of hard work, commitment, and attention to detail. At Grafana Labs, we use a cross-functional team approach to come up with ideas and solutions that ultimately make our products more usable, resilient, and adaptable to user needs. To achieve this, we work collaboratively across the UX, product, and engineering disciplines.

Have fun again creating, discover visual console and dashboard editing

The visual console editor allows the user to visually design the final layout by dragging elements with the mouse, choosing the background and the icons that represent the status of each relevant aspect you want to show. With dashboards you may define screens with different created visual elements and share them with other users or display them in full screen as slides for the whole team to see.

Dashboard Studio: Level-Up Your App with Dashboard Studio

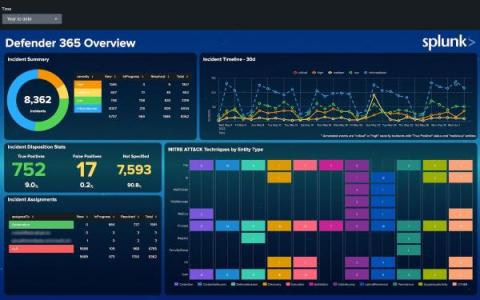
Dashboards are a powerful tool for communicating a lot of information at once. Many Splunk apps are packaged with dashboards to help you make the most of your data. For example, the Microsoft 365 App for Splunk comes with a number of dashboards to provide insights around usage, incidents, and more.

New in Grafana 9: Role-based access control (RBAC) is now GA

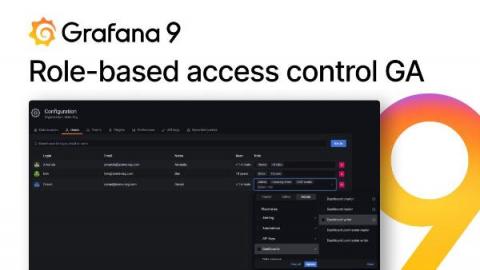
Role-based access control (RBAC), previously referred to as fine-grained access control (FGAC), is Grafana’s new authorization system. It was introduced as a beta feature in Grafana 8.0 release a year ago, and we’re now excited to promote it to general availability status. With the release of Grafana 9.0 during GrafanaCONline 2022, RBAC is enabled by default for all instances. (The easiest way to get started with Grafana 9? Sign up for a free Grafana Cloud account today.)

How to send logs to Grafana Loki with the OpenTelemetry Collector using Fluent Forward and Filelog receivers

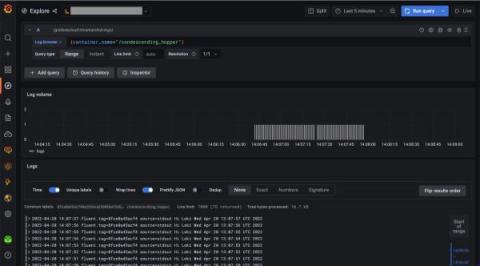
In this guide, we’ll set up an OpenTelemetry Collector that collects logs and sends them to Grafana Loki running in Grafana Cloud. We will consider two examples for sending logs to Loki via OpenTelemetry Collector. The first one shows how to collect container logs with a Fluent Forward receiver. The second one shows how to collect system logs with a Filelog receiver.

Anomaly rate in every chart

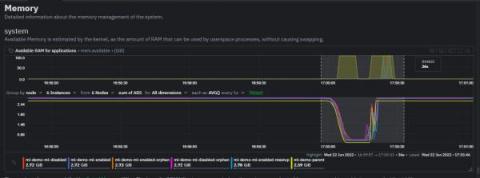
A month ago, we introduced unsupervised ML & Anomaly Detection in Netdata, the Anomaly Advisor. Today, we’re happy to announce that we’re bringing anomaly rates to every chart in Netdata Cloud. Anomaly information is no longer limited to the Anomalies tab and will be accessible to you from the Overview and Single Node View tabs as well. This will make your troubleshooting journey easier, as you will have the anomaly rates for any metric available with a single click.

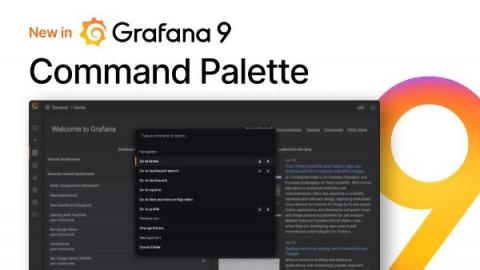
New in Grafana 9: Introducing the command palette

Grafana is an open source tool for people with many different perspectives and various skill levels. Many initiatives to improve the Grafana user experience start by thinking about someone who’s just getting started on their observability journey. However, late last year, a Grafana Labs hackathon team looked to improve the user experience for our power users by introducing a command palette to Grafana.

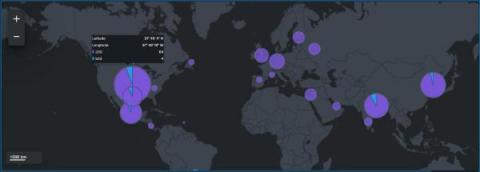
Dashboard Studio: More Maps & More Interactivity

In Splunk Cloud Platform 8.2.2203, we're continuing to expand on interactivity capabilities and visualizations for Dashboard Studio. We've added the ability to use search results and job metadata as tokens, and pass tokens through drilldowns to other dashboards. There is a new map visualization for cluster maps and UI to match strings for dynamic coloring. And finally, we've included the ability to set a Studio dashboard as your home dashboard.

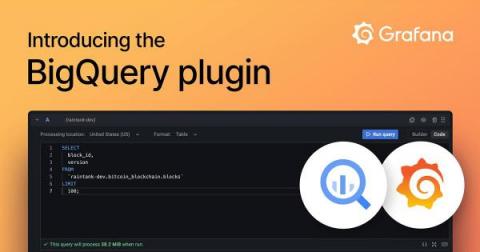
Introducing the new and improved Grafana BigQuery plugin

We are happy to announce that an official Google BigQuery data source plugin for Grafana has arrived! Based on the popular DoiT International BigQuery DataSource community plugin, the new Grafana BigQuery plugin brings a new and improved query editor experience plus support for all BigQuery data types, Grafana Alerting, and query caching.

GrafanaCONline 2022 Day 4 recap: Grafana Labs technical docs, citizen science with Grafana Cloud, load testing with Grafana k6, and more

GrafanaCONline 2022 wrapped up on Friday, and the big finish featured sessions that covered important changes in Grafana Labs technical documentation, Grafana Cloud’s role in activist engineering projects, and the benefits of load testing with k6. There was also a great success story out of East Africa, where a major bank switched to a business monitoring system with Grafana and improved its customer satisfaction and revenue.