Dashboards

What's next in Kubernetes monitoring, Prometheus histograms, observability, and more: KubeCon EU 2022 in review

In May, a team from Grafana Labs descended on Valencia, Spain, to share their latest insights on the cloud native landscape at KubeCon + CloudNativeCon EU 2022. Along with diving into the future of Kubernetes monitoring with kubectl alpha events and multi-cloud deployments, Grafanistas presented an overview of the Prometheus ecosystem with an eye towards how sparse high-resolution histograms are going to change the game.

Observability strategies that work - and some that don't

Creating an observability strategy is a lot like playing with Legos: It takes small building blocks to create a bigger picture, but the slightest mistake could throw off an entire build — and often you realize it very late in the process and have to rip and repair the Hogwarts castle infrastructure you spent many days creating.

Grafana for business intelligence: How Grafana Labs uses dashboards for more than observability data

Having joined Grafana Labs as one of our first data & analytics hires, I spent much of my time in the first few months considering how we should structure our data stack to optimize for a quick path to value, while allowing our small data team to scale going forward.

How to monitor an Umbrel server running a Bitcoin node with Grafana Cloud

Most people in the world are familiar with legal tender paper money — also known as fiat currency — and how to access it online through a bank website, ATM, or mobile app. The idea of “digital money” or cryptocurrency — such as Bitcoin — remains a relatively new concept.

Scaling Grafana Mimir to 500 million active series on customer infrastructure with Grafana Enterprise Metrics

At Grafana Labs, we’ve seen an increasing number of customers who are scraping hundreds of millions of active time series but need a solution to reliably store and query such a huge amount of data. So in March, we announced our new open source TSDB, Grafana Mimir, the most scalable, most performant open source time series database in the world.

Collect and visualize MySQL server logs with the updated MySQL integration for Grafana Cloud

Today, we are excited to announce that the MySQL integration has received an important update, which includes a new pre-built MySQL logs dashboard and the Grafana Agent configuration to view and collect MySQL server logs. The integration is already available in Grafana Cloud, our platform that brings together all your metrics, logs, and traces with Grafana for full-stack observability.

Introducing the macOS integration for Grafana Cloud

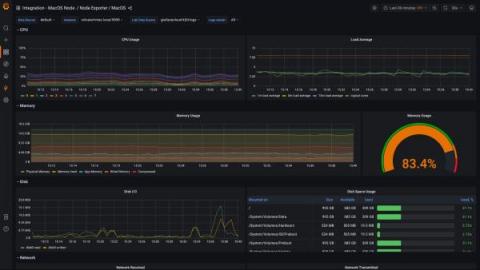
Today, we are thrilled to share that the macOS integration has finally arrived for Grafana Cloud! Thanks to the joint efforts of Grafana Labs’ multiple teams, you can monitor your Mac and gather and visualize metrics and logs with ease. The integration is available in Grafana Cloud, our platform that brings together all your metrics, logs, and traces with Grafana for full-stack observability.

Monitoring COVID-19 virus levels in wastewater using Grafana, Databricks, and the Sqlyze plugin

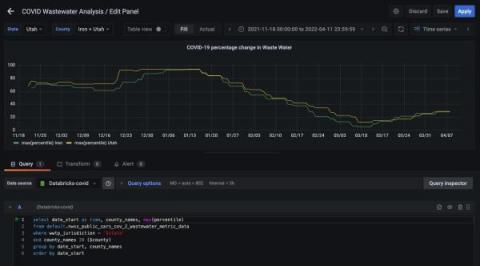
The new Sqlyze data source plugin (in beta) allows you to connect your Grafana instance to all your favorite SQL databases, many NoSQL databases, and many other non-SQL data sources — from document databases, to ERP systems, to even Slack. You don’t have to know the native query syntax for these data sources; you can just use SQL. The Sqlyze plugin uses ODBC at its core. Hundreds of ODBC drivers are available for various databases/data sources.

How to correlate logs and metrics with the Linux Node integration for Grafana Cloud

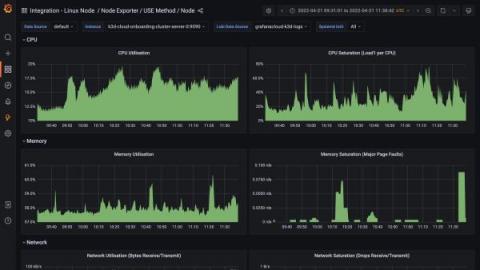
We are pleased to announce that an upgraded version of the Linux Node integration is available in Grafana Cloud, including the capability to visualize logs that are correlated with previously existing metrics. It also includes a new pre-configured dashboard based on the USE method, which focuses on showing resources utilization, saturation, and errors.

New release: SquaredUp 5.5

We’ve just released SquaredUp 5.5! As always, you’ll find some great new additional features as well as enhancements in the SquaredUp Community, Azure, and SCOM Editions. Plus, the new 5.5 release works with SCOM 2022. Here’s a quick overview of what’s new: Check out the release webinar here or keep reading for all the juicy details.