Dashboards

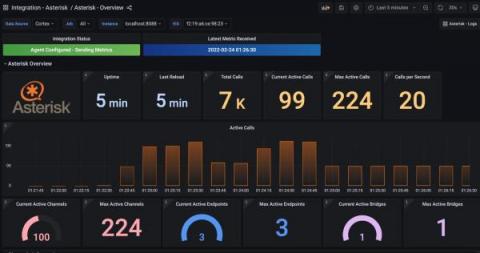
How to observe your Asterisk instance with Grafana Cloud

Observability and monitoring is a fundamental part of the contact center environment. When there are thousands of live voice and other multi-channel interactions happening, it is crucial to keep a close eye on the system because any issue in service gives an instant blow to the customer experience. Asterisk is a free and open source framework for building communications applications and is sponsored by Sangoma.

Fixing SCOM's blind spots

Since its origins as MOM 2000, SCOM has been widely regarded for being awesome at two things: firstly, being the hands-down best solution for monitoring Windows Server environments (it is Microsoft’s monitoring tool, after all); and secondly, being an extensible monitoring platform that can act as a single pane of glass across your data center environment.

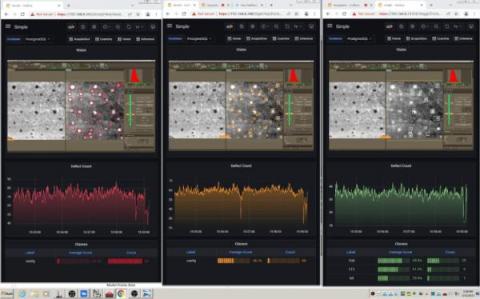
How Theia Scientific and Volkov Labs use Grafana and AI to analyze scientific images

Dr. Christopher Field is Co-Founder, President, and Principal Investigator at Theia Scientific. With formal education in analytical chemistry and instrumentation, Chris has expertise in scientific hardware and software design, deploying embedded Linux devices for Internet of Things (IoT) and sensor fusion applications, and developing computer vision and image processing pipelines for cell analysis.

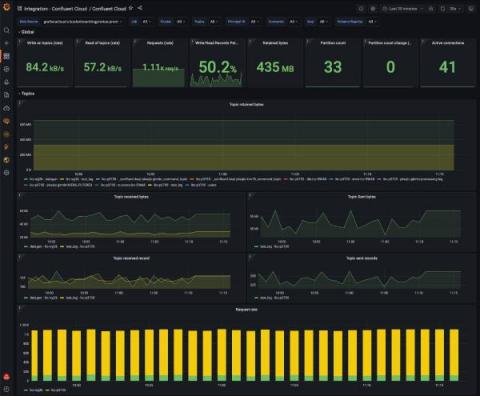
Introducing the new Confluent Cloud integration for Grafana Cloud

At Grafana Labs, we’re continuing to expand our platform of Grafana Cloud integrations that make it easier than ever to connect and monitor external systems. These integrations enable you to answer the big picture questions in your organization and tell your observability story.

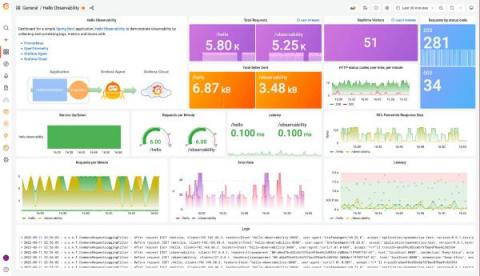
Set up and observe a Spring Boot application with Grafana Cloud, Prometheus, and OpenTelemetry

Spring Boot is a very popular microservice framework that significantly simplifies web application development by providing Java developers with a platform to get started with an auto-configurable, production-grade Spring application. In this blog, we will walk through detailed steps on how you can observe a Spring Boot application, by instrumenting it with Prometheus and OpenTelementry and by collecting and correlating logs, metrics, and traces from the application in Grafana Cloud.

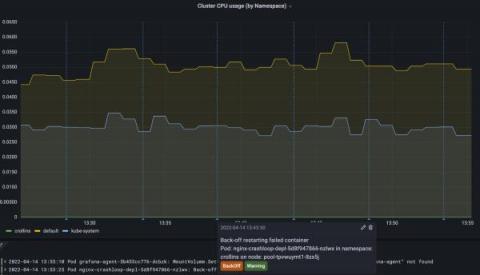
New in the Kubernetes integration for Grafana Cloud: Kubernetes events, Pod logs, and more

The Kubernetes integration for Grafana Cloud helps users easily monitor and alert on core Kubernetes metrics using the Grafana Agent, our lightweight observability data collector optimized for sending metric, log, and trace data to Grafana Cloud. It packages together a set of easy-to-deploy manifests for the Agent, along with prebuilt dashboards and alerts.

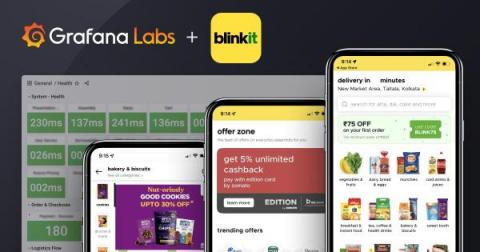
eCommerce giant Blinkit's journey from ELK Stack to Grafana Cloud

The promise: Order any groceries and essentials from Blinkit’s mobile app, and they’ll be delivered to your doorstep within 10 minutes. The process: Very difficult with a legacy logging tool. For Blinkit, the instant delivery service formerly known as Grofers that serves millions of consumers across India, their tech stack was beginning to interfere with business operations at a time when the company was hyperscaling due to its popularity.

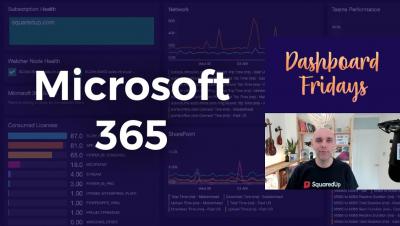
Dashboard Fridays: Sample M365 dashboard

In this latest Dashboard Fridays episode, join our VP of Innovation Adam Kinniburgh as he showcases this M365/O365 dashboard built with SquaredUp. This summary dashboard built for the MP using SCOM Edition gives a clear overview of your M365/0365 health, including: subscriptions, consumed licences, network issues, teams performance, mail flow duration and more. This dashboard pack also includes a bunch of cool perspectives with dedicated views (open and closed alerts, metrics, health) for different components, including licencing, teams, alerts and more.

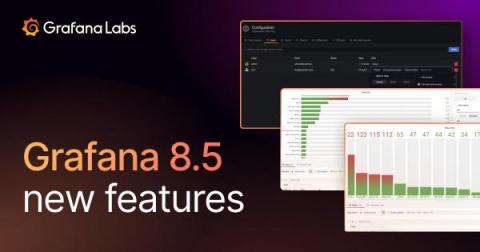
New in Grafana 8.5: updated panels, new RBAC features, simplified reporting, and more!

Grafana 8.5 is here! Download Grafana 8.5 We’ve worked on a variety of improvements that focus on Grafana’s usability, data visualization, and security. For a full list of new features and capabilities, check out our What’s New in Grafana 8.5 documentation. You can get started with Grafana in minutes with Grafana Cloud. We have free and paid Grafana Cloud plans to suit every use case — sign up for free now.