Dashboards
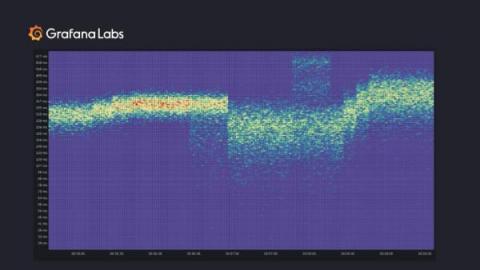
How sparse histograms can improve efficiency, precision, and mergeability in Prometheus TSDB
Grafana Labs recently hosted its first company-wide hackathon, and we joined forces with Björn “Beorn” Rabenstein to bring sparse high-resolution histograms in Prometheus TSDB into a working prototype. The Prometheus TSDB has gained experimental support to store and retrieve these new sparse high-resolution histograms. At PromCon 2021, we presented our exciting, fresh-off-the-presses results from the ongoing project.
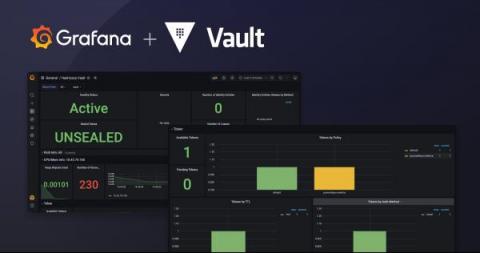
Introducing new integrations to make it easier to monitor Vault with Grafana
HashiCorp Vault is an increasingly popular multi-cloud security tool that allows users to authenticate and access different clouds, systems, and endpoints, and centrally store, access, and deploy secrets. At Grafana Labs, we’re always looking for ways to make it easy for our community to get started monitoring important parts of their systems. So we’re happy to share some new integrations that will help our users get the most out of Grafana + Vault.
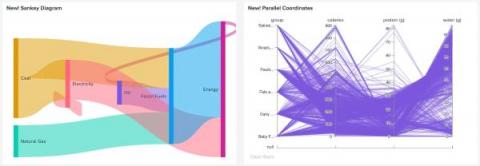
Dashboard Studio: New Features Highlighted At .conf21
I am very excited that this year’s.conf21was the first.conf where we got to showcase Dashboard Studio, which has come built-in with every Splunk Enterprise and Splunk Cloud Platform release, since 8.2 and 8.1.2103, respectively. I am even more excited to share a packed list of new features in the 8.2.2109 release, which coincides with.conf21! This blog post will highlight a few capability areas we've been heavily focused on that will help you do even more with your dashboards.
Get control back into the Control Room
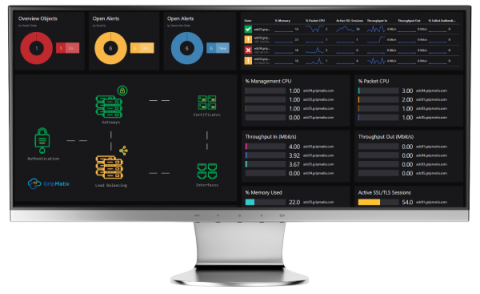
This article explains how SquaredUp for SCOM leverages the true power of the SCOM platform: the SCOM object model. I believe in dashboarding you need simplicity and granularity all in one. Simplicity for your Control Room, which gives clear and quick insight. Granularity and detail for your system management engineers to be able to drill-down into details and find that Root-Cause quickly.
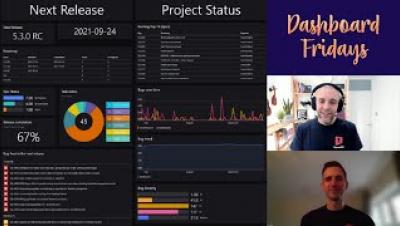
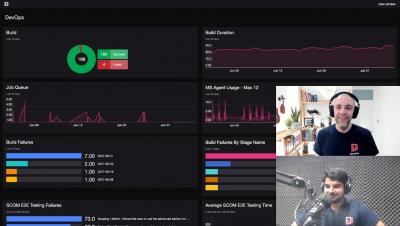
Dashboard Fridays: Sample Azure DevOps Dashboard
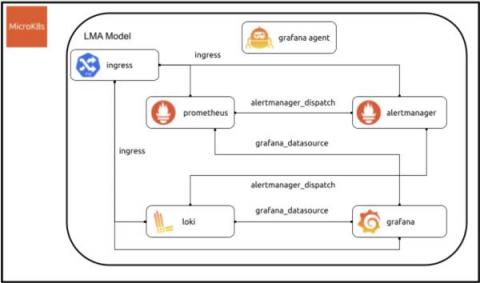
"Open source done right": Why Canonical adopted Grafana, Loki, and Grafana Agent for their new stack
Michele Mancioppi is a product manager at Canonical with responsibility for observability and Java. He is the architect of the new system of Charmed Operators for observability known as LMA2. Jon Seager is an engineering director at Canonical with responsibility for Juju, the Charmed Operator Framework, and a number of Charmed Operator development teams which operate across different software flavors including observability, data platform, MLOps, identity, and more.
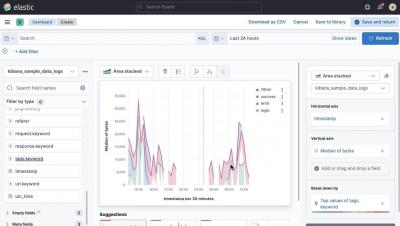
Creating bar, line, and area charts using Kibana Lens
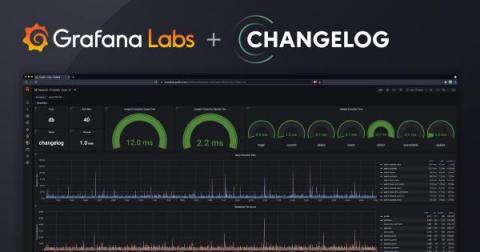
How Changelog monitors and optimizes website performance with Grafana Cloud
Developers around the world get their news from Changelog, an indie media company on a mission to create inspiring content for software developers. Through their popular podcasts, including The Changelog, Go Time, JS Party, and Ship It!, the team at Changelog helps listeners stay up-to-date on the latest happenings, trends, and tools in a constantly evolving industry.
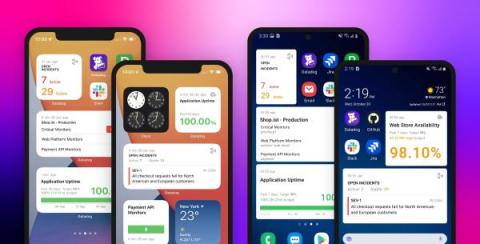
Improve your on-call experience with Datadog mobile dashboard widgets
Life happens—even when you’re on-call. You can’t take your laptop everywhere, but whether you’re on the train, at dinner, or at the gym, you can count on the Datadog mobile app for access to key data about the status and performance of your applications. Now, you can use Datadog mobile widgets to build an on-call mobile dashboard directly on your phone’s home screen, so it’s even easier to track the data you care about from anywhere.

