Operations | Monitoring | ITSM | DevOps | Cloud
APM
The latest News and Information on Application Performance Monitoring and related technologies.
The Agents of Transformation Report 2020: COVID-19 Special Edition
We interviewed 1,000 IT professionals around the world to see how the pandemic is impacting business continuity efforts. Here's what we learned.
How to Create a Graph Using Tags and Time Aggregation | Datadog Tips & Tricks
How To Monitor Containers in Real-Time with Datadog Live Containers | Datadog Tips & Tricks
Citrix Analytics for Performance - Where does it fit in relation to Citrix Performance Monitoring and Management?
I recently published an article on Citrix Performance Analytics (also called Citrix Analytics for Performance), part of the Citrix Analytics service in Citrix Cloud. In this article, i will analyze where Citrix Performance Analytics fits in relative to other Citrix performance monitoring and management tools in the market.
Synthetic Monitoring vs. APM Stack Trace Tools
The complexity of an application’s digital architecture is increasing dramatically every day. In an era of cloud infrastructure, the goal is to integrate all your web services into one place: CDN, DNS, third-party API services, QA tools, analytics tools, and any other component you can think of, are working with each other to make your services function. With so many components in place for an application to run, each one of these behaves like its own black box within your IT infrastructure.
How to Use Amazon EventBridge to Perform Auto-Remediation | Datadog Tips & Tricks
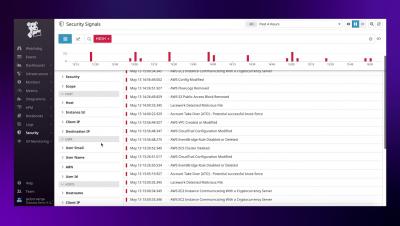
Datadog Security Monitoring Overview
How to easily correlate logs and APM traces for better observability
Application performance monitoring (APM) and logging both provide critical insight into your ecosystem. When paired together with context, they can provide vital clues on how to resolve problems with your applications. As the log data you analyze becomes more complex, navigating to the relevant pieces can be tricky using traditional tools. With Elastic Observability (powered by the Elastic Stack), correlating logs with APM is as simple as a few clicks in Kibana.
Introducing Shifting Left: A New IT Content Series from AppDynamics
Shifting Left is a new IT content series for people to who want to learn faster, build smarter, and innovate more. Here's what you can expect.


