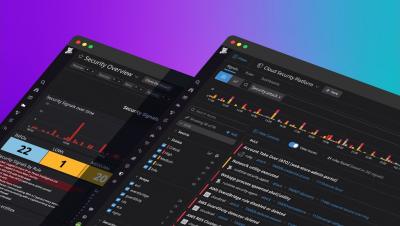
Operations | Monitoring | ITSM | DevOps | Cloud

APM

The latest News and Information on Application Performance Monitoring and related technologies.

Sponsored Post

Achieving a 12% performance lift migrating Raygun's API to .NET Core 3.1

Here at Raygun, improving performance is baked into our culture. We don't just think about our application performance, but more broadly, we look at our own infrastructure and ask if there's anything we can do to make it more performant for our business and for our customers. Two years ago, we switched our API from Node.js to .NET Core and achieved a 2000% increase in throughput. To continue that story, we recently upgraded .NET Core 2.1 to 3.1 and saw a 12% increase in performance. We enjoy presenting our performance findings, so in this post, we'd like to give some context into why we upgraded and the conditions that helped us achieve the 12% performance lift.

Best Practices for Monitoring Azure Services

Monitoring your Azure cloud computing environment requires an understanding of each component of your Azure infrastructure and how they all interact. Cloud computing with Azure offers each of the three main advantages of cloud service providers: infrastructure as a service (IaaS), platform as a service (PaaS), and software as a service (SaaS). Combined, these three services provide a comprehensive cloud-based computing setup for any business.

Be a Better Java Developer With AppOptics Dev Edition

Monitoring your Java applications is an essential part of ensuring high availability and good performance. And yet, many Java developers hold off on practicing application performance management (APM) until they’ve already deployed their application to a test environment, or even to production. Perhaps they don’t have access to an APM solution with the right insights, or maybe they don’t have the time or resources to deploy to a temporary environment and wait for metrics to come in.

Observability at The Edge with Fastly and Datadog

You use CDNs because they allow you to serve content as quickly and reliably as possible. But how well are your systems performing? How securely are you moving data—and how do you know which parts of your environment are slowing you down? Learn how to improve end user experiences, accelerate development, and take full advantage of edge computing in this joint webinar.

Driving Service Reliability Through Autoscaling Workloads on OpenShift

In this webinar, Ara Pulido, Technical Evangelist at Datadog, will demonstrate how to autoscale your application workloads on OpenShift. You will learn frameworks for how to identify their key work and resource metrics; as well as how to use them to drive horizontal and vertical pod autoscaling so that you can maximize efficiency, while ensuring service reliability.

Why an OS Monitoring tool is not sufficient for Monitoring VMware and Other Virtualization Technologies

You have management software that you’ve used for your Linux or Windows servers. Can’t you just deploy a Linux agent and monitor a VMware vSphere/ESX server, or a Windows agent to monitor a Microsoft Hyper-V server? This is a very common question that comes up in any discussion on VMware monitoring and virtualization management. After all, when a VMware ESX server boots, the administrator gets to a Linux login prompt and can login to a Linux operating system.

Minimize business losses by monitoring your applications' performance

Downtime is the biggest nightmare for organizations that capitalize on technology. A study about enterprise outages found that nearly 96 percent of enterprises had faced downtime in the past three years. Businesses lose a minimum of $1.55 million annually and 545 hours of staff time due to IT downtime. Up to 51 percent of downtime is preventable, which means businesses are spending on damage control when these resources could be diverted to something more fruitful, like R&D.

Track any web performance metric with improved custom timings for Real User Monitoring

Over the past few years, we’ve witnessed a couple of key trends in the performance monitoring space. Adoption of single-page applications (SPAs) has continued to grow and as such performance monitoring is evolving. SPAs don’t offer the same existing web metrics like load time or first paint from the browser performance API. As a result, developers require more flexibility to track the metrics that matter to their end-users and business.