Operations | Monitoring | ITSM | DevOps | Cloud

APM

The latest News and Information on Application Performance Monitoring and related technologies.

How to easily correlate logs and APM traces for better observability

Application performance monitoring (APM) and logging both provide critical insight into your ecosystem. When paired together with context, they can provide vital clues on how to resolve problems with your applications. As the log data you analyze becomes more complex, navigating to the relevant pieces can be tricky using traditional tools. With Elastic Observability (powered by the Elastic Stack), correlating logs with APM is as simple as a few clicks in Kibana.

AppOptics Application Service Map

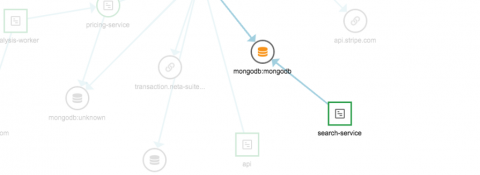
Announcing automatic dependency mapping in SolarWinds AppOptics When your team responds to a latency alert on a single service, how do they know how (or if) the increased latency in one service affects the end user? With the SolarWinds® AppOptics™ service map, teams can easily view the relationships between services, and see how (or if) a service is connected to the end user.

ManageEngine recognized in Gartner Magic Quadrant for Application Performance Monitoring

We are happy to announce that ManageEngine has been recognized by Gartner in its 2020 Magic Quadrant for Application Performance Monitoring. Applications Manager has helped thousands of customers across the globe streamline and manage their servers and applications effectively.

How to Monitor Citrix Remote PC

Ever since the beginning of the COVID-19 pandemic and the resulting lockdowns, working from home has instantly become the primary way of work for most people. Even companies that already had functionality in place to work from home were instantly hit by scalability issues. Many of the existing solutions typically weren’t meant to be used for a 100% concurrent remote workforce.

APM - Diving in to the async profiler feature of the java APM agent

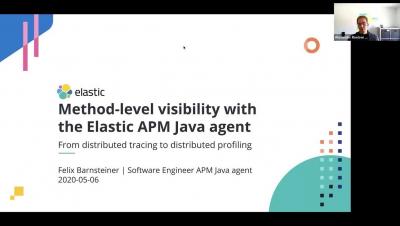
Distributed tracing is great — it helps you identify (micro)services within complex architectures having issues interfering with user experience, such as high latency or errors. But once a problematic service is identified, it can be difficult to find out which methods are to blame for the slowdown. In this presentation, Felix Barnsteiner (one of the core developers of the APM Java Agent) will show you the different ways to get method-level insight into your application. Specifically, we’ll have a look at the newly added support for profiler-inferred spans that is based on a sampling profiler.

The Application Performance Monitoring Journey

One of the best parts of our job is enabling you to become the best #ITPerformanceHero that you can be. But behind the scenes, eG Innovations is filled with talented team members who wear their own IT Hero capes. We want to take some time to introduce you to some of the people who make eG Innovations the leading performance monitoring company on the market. We’re pleased to introduce Arun Aravamudhan, Head, APM and Web UX products.