Mailchimp
Not subscribed to OpsMatters Newsletter


When you are configuring your event log monitor settings, you need to decide which event log events you need to worry about. Event logs are generated for a wide array of processes, applications, and events. Logs will record both successes and failures. As such, you need to decide what data is most vital and needs your immediate attention.
When starting a cloud migration project, one of the most important and often challenging parts is to have an accurate understanding of what you are trying to migrate. Over time, companies start new projects, which means creating new infrastructure, adding servers, databases, etc. This is a normal part of the development cycle. However, despite best efforts, inventories get out of sync.
There is an idea of the relationship between observability and monitoring, that they complement each other in an inseparable way. While true that you can only monitor a system that is observable, the line dividing observability and monitoring grows narrower with every deployment you make; making these two practices less of a pairing and more a single entity.
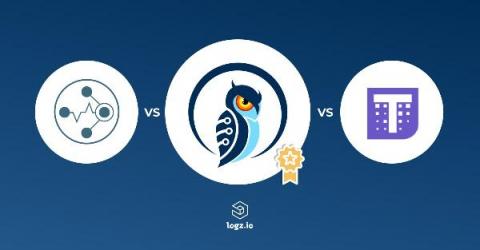
Logz.io is focused on creating the best observability service to manage the scale of monitoring, add value on top of AI/ML technologies, and enhance enterprise security. Metrics is one of the pillars of Logz.io, and our Prometheus-as-a-Service offering. It has been a crucial part of our platform goals, but if we turn the clocks back a year, our service only used the open-source Elasticsearch database (ES).
Software companies are in a constant pursuit to optimize their delivery flow and increase release velocity. But as they get better at CI/CD in the spirit of “move fast and break things,” they are also being forced to have a very sobering conversation about “how do we fix all those things we’ve been breaking so fast?” As a result, today’s cloud-native world is fraught with production errors, and in dire need of observability.
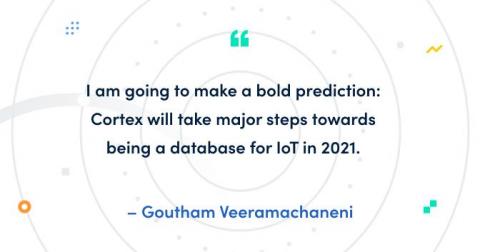
My Grafana Labs colleague RichiH recently talked about why IoT and time series databases work so well together. It just so happens that we have a highly scalable time series database on hand. Let’s talk about that. My name is Goutham, and I am a maintainer for Cortex. I have been working on it for nearly three years out of the four-and-a-half years the project has existed. Cortex is built to serve as a scalable, long-term store for Prometheus.
Monitoring the current state and performance of applications is critical for IT Ops and DevOps teams alike. Understanding the health of an application is one of the most effective ways of anticipating potential bottlenecks or slowdowns, yet it’s one of the largest challenges faced by many organizations that build and deploy software. This is largely due to applications’ distributed and diversified nature.
“What is GitOps?” – a question which has seen increasing popularity on Google searches and blog posts in the last three years. If you want to know why then read on. Quite simply, the coining of GitOps is credited to one individual, and pretty smart guy, Alexis Richardson. He’s so smart that he’s built a multi-award-winning consultancy, Weaveworks, and a bespoke product, Flux, around the GitOps concept.