Mailchimp
Not subscribed to OpsMatters Newsletter


Performance profilers mainly aid developers in analyzing the performance of applications. The purpose is to improve poorly performing sections of code that make up the functions of the application. When you say performance profilers, common names that come to mind are Visual Studio performance profilers and Prefix by Netreo. In this article, we will focus on the specific Visual Studio profiling tools for memory and CPU usage.
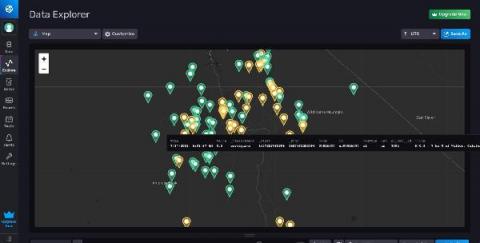
We recently introduced a new Map graph type into InfluxDB Cloud to help users visualize time series data that includes position. Above is a graph showing the most recent earthquakes in California, where the color of the marker indicates their magnitude. In this post, I’m going to walk through the ways to ingest geotemporal data into InfluxDB Cloud, and how to use the new Maps visualization type.
A Maori proverb says, “What is the most important thing in the world? It is the people, it is the people, it is the people.” At New Zealand Trade and Enterprise (NZTE), a government-owned business development agency responsible for supporting exporters from more than 50 countries, we live by that proverb, keeping people at the center of everything we do. Our aim is to promote a productive, sustainable, and inclusive economy in New Zealand and the world.
In Episode 1 of the OCTOpod, Alan Clark talks with Thierry Carrez about open source communities: what they are, how they work and how you can get involved.
The end-to-end monitoring of complex software systems is difficult, toil-intensive and error-prone. Developers, SREs and Platform teams must continuously invest effort in setting up and maintaining the monitoring setups that underpin the observability of their systems, or accept the risk of being unaware of ongoing issues and their impact on end users. Enter model-driven observability powered by Juju!