Mailchimp
Not subscribed to OpsMatters Newsletter


Optimizing Kubernetes costs isn’t an easy task. Kubernetes is as deep a topic as cloud (and even more complex), containing subtopics like: That’s a lot for a busy DevOps team to understand and manage, and doesn’t even consider that line-of-business stakeholders and finance team members should have some understanding of each cost driver’s function and importance to contribute to a successful FinOps Strategy.
As the complexity of Kubernetes environments grow, costs can quickly spiral out of control if an effective strategy for optimization is not in place. We’ve compiled expert recommendations and best practices for running cost-optimized Kubernetes workloads on AWS, Microsoft Azure, and Google Cloud (GCP).
It’s important for both technical and business teams to understand the different web performance monitoring options that are available as well as their various use cases and the benefits of each. In this article, we’ll compare synthetic monitoring and real user monitoring (RUM).
There are many different classes of web performance tools, from synthetic monitoring to application performance monitoring (APM), to real user monitoring (RUM), and more. These different classes exist because each has its own strengths and weaknesses. When evaluating open-source or enterprise-grade synthetic monitoring tools, you want to look for capabilities that maximize its strengths.
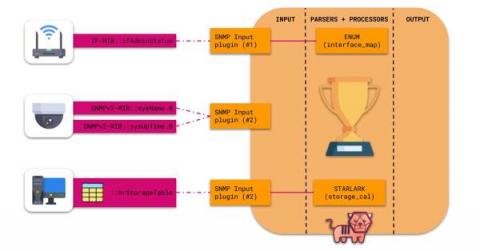
Telegraf has now reached 300+ plugins and is deployed in a wide variety of use cases. In January we released a blog post covering the golden rules for creating configs and optimizing your Telegraf agent. It’s now about time we got our hands dirty covering some of the plugins the community uses the most. In this post, we are going to cover the SNMP Input Plugin.