We help you find and fix issues with your cloud apps fast. Exoprise is the leading solution provider for monitoring SaaS services like Microsoft 365, Box, Dropbox, Salesforce.com and more.
From databases to servers, communication systems, operating systems and custom applications, NiCE provides the right application monitoring solutions and services.
Monitive is an uptime monitoring service, where users sign up and input their website address, which we check every minute, from a random location around the world, and instantly notify them when their site is down.
EventSentry is an award-winning Hybrid SIEM which features real-time log, system health and network monitoring to proactively monitor networks and preemptively respond to threats.
ManageEngine crafts comprehensive IT management software with a focus on making your job easier. Our 90+ products and free tools cover everything your IT needs, at prices you can afford.
Raygun is a Software Intelligence Platform that gives companies visibility into software problems. Errors, crashes and slow loading pages and scripts affecting end users are automatically detected, enabling teams to build excellent user experiences.
Logs are an integral part of any system that helps you get information about the application state and how it handles its operations. The goal of this blog is to compare the commonly used logging solutions, i.e., ElasticSearch(ELK stack) and Loki(PLG stack), with SigNoz on three parameters: ingestion, query, and storage. Performance benchmarks are not easy to execute. Each tool has nuances, and the testing environments must aim to provide a level playing field for all tools.
Like many companies, Stack Overflow is trying to get out of the business of running our architecture in our own data centers; instead, we want to offload some of the more mundane parts of system administration to a cloud service offering like Azure. I’m going to cut to the chase for the purpose of this article and concede we’ve already decided on Azure for the majority of our infrastructure and, most importantly to me, our databases.
As a data professional, I often think about all the things around me generating data and consider where this data is ultimately being used. Have you ever taken a minute to consider exactly how much data is being generated at any point in time? I love collecting data and looking at ways it can be used and living in a “smart” home with appliances logging and reporting usage patterns certainly provides a lot of opportunities.
When challenges arise, leaders and teams quickly assess the situation, reorient themselves, double down on what works, and pull away from what doesn't. That's why it's important for workplaces to evolve towards being resilient, human-centric, sustainable, and extremely adaptable. With the bumpy road ahead, workplaces have to adapt to successfully drive out of the recession and stay ahead of the curve.
A knowledge base enables end-users to resolve L1 issues, search for department-specific processes in the organization, and understand how services or products work. Learn how your organization can build and maintain a robust knowledge base using ServiceDesk Plus.
This SquaredUp dashboard shows key metrics from any GKE (Google Kubernetes Engine) clusters and node groups, including utilization of resources and health status. Tune in to learn how it was made, the challenges it solves, and our top tips for building it yourself.
This SquaredUp Grafana dashboard surfaces status information from Grafana, giving you a big picture overview across teams and apps – all while allowing you to utilize your existing dashboards and alert rules. Tune in to learn how it was made, the challenges it solves, and our top tips for building it yourself.
This Google Compute Engine dashboard shows key metrics about any GCE instances, managed instance groups, and related resources such as GCE disks. These metrics include utilization of resources and health status. Tune in to learn how it was made, the challenges it solves, and our top tips for building it yourself.
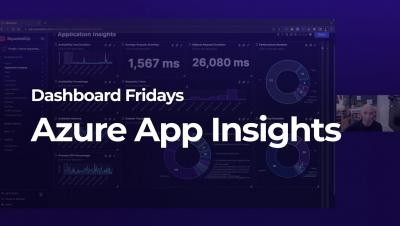
This SquaredUp dashboard uses the Azure plugin to surface key performance metrics from Application Insights. Common user experience metrics are all provided out of the box, and we can query, summarize, and analyse the raw logs and traces. Tune in to learn how it was made, the challenges it solves, and our top tips for building it yourself.
Red Hat is a global leader for open source enterprise IT solutions with a portfolio of products that includes hybrid cloud infrastructure, middleware, cloud-native applications, and automation solutions.