Operations | Monitoring | ITSM | DevOps | Cloud
Tracing
The latest News and Information on Distributed Tracing and related technologies.
OpenTelemetry on AWS, beyond instrumentation and into resource attributes
Instrumenting your code is essential to understanding your system’s performance and diagnosing issues as they arise. Traditionally, this was accomplished using proprietary vendor libraries, causing major lock-in. Enter OpenTelemetry. OpenTelemetry is an open-source project that provides a set of APIs, SDKs, and integrations for instrumenting code.
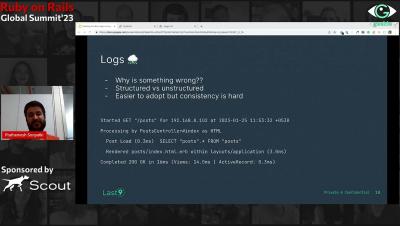
Peeking into Rails apps using OpenTelemetry
Understand serverless function performance with Cold Start Tracing
Serverless developers are undoubtedly familiar with the challenge of cold starts, which describe spikes in latency caused by new function containers being initialized in response to increasing traffic. Though cold starts are usually rare in production deployments, it’s still important to understand their causes and how to mitigate their impact on your workload.
Trace-based testing with Elastic APM and Tracetest
This post was originally published on the Tracetest blog. Want to run trace-based tests with Elastic APM? Today is your lucky day. We're happy to announce that Tracetest now integrates with Elastic Observability APM. Check out this hands-on example of how Tracetest works with Elastic Observability APM and OpenTelemetry! Tracetest is a CNCF project aiming to provide a solution for deep integration and system testing by leveraging the rich data in distributed system traces.
Experiment: Migrating OpenTracing-based application in Go to use the OpenTelemetry SDK
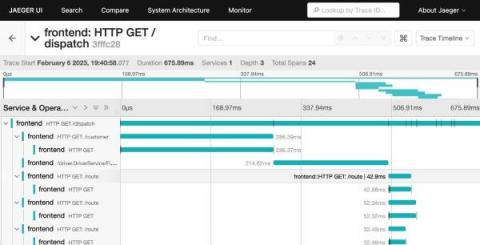
Jaeger’s HotROD demo has been around for a few years. It was written with OpenTracing-based instrumentation, including a couple of OSS libraries for HTTP and gRPC middleware, and used Jaeger’s native SDK for Go, jaeger-client-go. The latter was deprecated in 2022, so we had a choice to either convert all of the HotROD app’s instrumentation to OpenTelemetry, or try the OpenTracing-bridge, which is a required part of every OpenTelemetry API / SDK.
Get to know TraceQL: A powerful new query language for distributed tracing
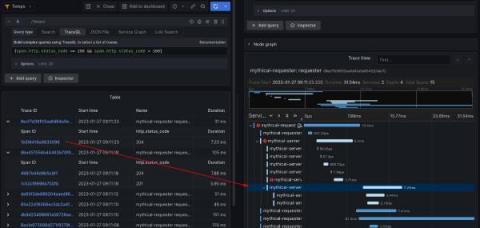
At Grafana Labs, we love tracing, which is why we’ve been hard at work on Grafana Tempo, an open source, highly scalable distributed tracing backend. Tempo just had its 2.0 release. In conjunction with that release, we are excited to show off TraceQL — a powerful new query language designed for distributed tracing. In this blog, we’ll provide an overview of why we created TraceQL, how it works, how you can put it to use today, and what we have planned for future iterations.
Connecting OpenTelemetry to AWS Fargate
OpenTelemetry is an open-source observability framework that provides a vendor-neutral and language-agnostic way to collect and analyze telemetry data. This tutorial will show you how to integrate OpenTelemetry with Amazon AWS Fargate, a container orchestration service that allows you to run and scale containerized applications without managing the underlying infrastructure.
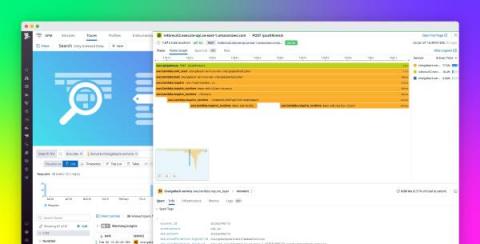
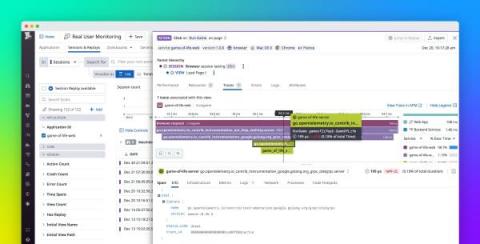
Correlate Datadog RUM events with traces from OTel-instrumented applications
OpenTelemetry (OTel) is an open source, vendor-neutral observability framework that supplies APIs, SDKs, and tools for the instrumentation of cloud-native applications and services. OTel enables you to collect metrics, logs, and traces from a variety of sources and route them to various backends. By itself, however, it can’t help you analyze this data or correlate telemetry from different parts of your stack.
Complete observability & monitoring of your integration infrastructure
Integration is a fundamental part of any IT infrastructure. It allows organizations to connect different systems and applications together in order to share data and information. As organizations become more complex and interconnected, they need to ensure they have complete observability and monitoring of their integration architecture. This is essential in order to discover, understand and fix any issues that can arise.


