Operations | Monitoring | ITSM | DevOps | Cloud

%term

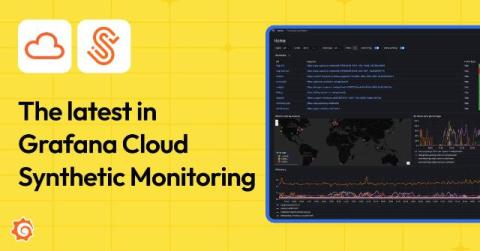
The evolution of Grafana Cloud Synthetic Monitoring: new features, pricing updates, and more

With 2024 coming to a close, it’s a good time to reflect on how Grafana Cloud has evolved this year — and synthetic monitoring, in particular, is one area where we’ve really focused our efforts. In May, we rolled out a revamped version of Grafana Cloud Synthetic Monitoring with the overall goal of making your monitoring processes not just more efficient, but more impactful.

Best Practices for On-Call Rotation

On-call rotations are crucial for ensuring that technical teams are ready to tackle incidents, outages, or emergencies outside of regular hours. (Check our detailed guide on understanding on-call rotations in incident management). This system assigns specific team members to be available for immediate response, ensuring someone is always on duty to address critical issues.

Understanding On-Call Rotation in Incident Management

On-call rotation is a system where team members take turns being available to handle urgent issues outside regular working hours. This is crucial in fields like IT, healthcare, and customer service, where quick responses can greatly affect service continuity and customer satisfaction. The on-call engineer is tasked with diagnosing and fixing problems to minimize disruptions and maintain platform stability.

The KPI Commandments: A Guide to Setting Targets in IT

As VP of Business Applications at SolarWinds, I have the privilege of working with a team of IT professionals dedicated to achieving operational excellence. Our internal metrics for mean time to repair (MTTR), mean time to acknowledge (MTTA), and customer satisfaction (CSAT) all range between 95% and 100%, but what are the stories behind the percentages?

ECS Vs. Kubernetes: A Detailed Guide To Container Solutions

Containers improve application development with portability, efficiency, and scalability while accelerating deployments. Amazon ECS and Kubernetes are two of the top choices for container orchestration, but how do they stack up against each other? In this guide, we’ll break down the key differences, helping you choose the right solution for your containerization needs.

Uptime vs. Availability: What's the Difference and Why It Matters

In June 2019, a curious thing happened. Students were forced to go fully analog, putting pencil to paper when they couldn’t log in to their Google Classroom accounts. Avid media consumers sat staring blankly at buffering YouTube videos. Gmail notifications came to a screeching halt as inboxes sat eerily quiet. It wasn’t that the Google Cloud Platform had crashed — far from it.

Industrial cybersecurity: the journey towards IEC 62443 compliance

Industrial cybersecurity is on every CISO’s mind as manufacturers strive to integrate their IT and OT operations to drive efficiency and productivity. However, with increased connectivity comes heightened risk. This means that securing devices, networks, and systems is a critical challenge.

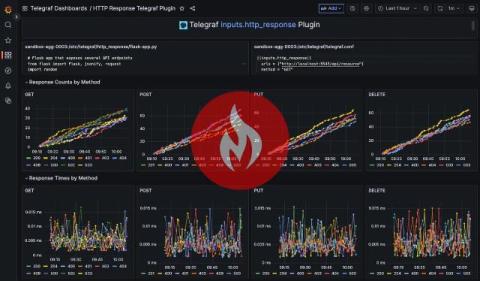
Easiest Way to Monitor Your API Endpoints Using Telegraf

Monitoring the health of your API endpoints is crucial to keeping your applications running smoothly and ensuring users have a reliable experience. Keeping an eye on 4XX and 5XX status codes can help you spot issues like client errors, misconfigurations, or server problems before they get out of hand. Plus, setting up alerts for when these errors spike allows you to react quickly, fix problems, and maintain a high-quality service that your users can count on.

The Leading SNMP Monitoring Tools

SNMP, which stands for Simple Network Management Protocol, is often viewed as a legacy protocol, with SNMP not being actively worked on anymore, which led to both Microsoft and Google pronouncing that SNMP was dead. Yet, SNMP is still commonly used by numerous industries as the advantages of SNMP, especially for network monitoring, are profound. Practically, all network components across all vendors possess built-in SNMP capability.