Operations | Monitoring | ITSM | DevOps | Cloud

%term

MTTR guide: how to improve system reliability & response time

Your system just went down. Your team scrambles around frantically while customers flood your inbox with complaints. Each passing minute feels like an eternity — sound familiar? DevOps and SRE teams know this scenario all too well. Meantime to repair (MTTR) directly impacts your customer trust and company reputation. MTTR might seem simple on the surface — measure how long it takes to fix problems. But nailing this metric takes more than just tracking numbers.

Simplify operations across hybrid cloud with OpsRamp

According to IDC, 80% of organizations are running hybrid and multicloud environments, bringing new complexities and risks for IT leaders*. When it comes to operations, IT teams find it challenging to maintain visibility across cloud and on-prem systems, optimize more and more tools, and automate operations—all while ensuring cost efficiency and staying agile. Traditional approaches complicate things further, often leading to silos and inefficient resource use.

What is Network Discovery? Everything You Need to Know

Network discovery is the crucial first step for any IT team looking to manage a modern, dynamic network. As companies embrace flexible work options and adopt complex hybrid environments, taking stock of all connected devices is essential to maintain performance, ensure security, and enable users to stay productive from anywhere. This article will cover everything you need to know about network discovery, from its core purpose to how it works to the tools that make it happen.

Meet the InvGate Product, Implementation, and Customer Success Teams

Behind the scenes at InvGate: How we build outstanding ITSM and ITAM solutions Join our team as we explore the philosophy, challenges, and innovations that drive InvGate's approach to IT Asset Management (ITAM), IT Service Management (ITSM) and Enterprise Service Management (ESM). In this exclusive conversation, our experts discuss: How we build solutions for different user types The key challenges in implementing Service Management tools Strategies for continuous innovation and customer success Balancing complexity with user-friendly design.

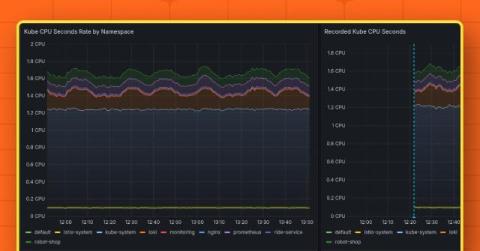
Grafana Alerting: Save time and effort with Grafana-managed recording rules

Grafana Alerting has seen steady growth and adoption since it was revamped in Grafana 9. Since then, we’ve been busy making your alerts more robust, more reliable, and easier to manage. As part of that process, Grafana Alerting has adopted several concepts from Prometheus. The Prometheus alerting model is well understood and flexible, and with Grafana Alerting we want to bring that same flexibility to all Grafana data sources.

Documentation, development and design for technical authors

Typically, a technical writer takes the product created by a development team, and writes the documentation that expresses the product to its users. At Canonical we take a different approach. Documentation is part of the product. It’s the responsibility of the whole team. Documentation work is led by a technical author, who is part of the team, and whose title signals their technical authority.

Introducing Datadog's Next-Generation Rust-based Lambda Extension

In 2021, we announced the release of the Datadog Lambda extension, a simplified, cost-effective way for customers to collect monitoring data from their AWS Lambda functions. This extension was a specialized build of our main Datadog Agent designed to monitor Lambda executions.