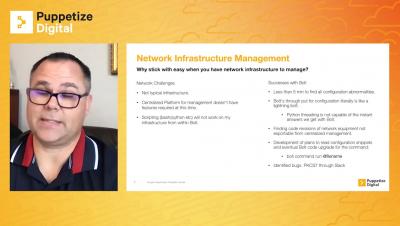
Bolting your way through Raspberry Pi and Network configuration standards
How network engineers discovered best practices for Bolt implementation through management of Raspberry Pi distribution. Making sense of Bolt's file structure, nuances, and unwritten rules. Expansions of Bolt plans and commands beyond Raspberry Pi into networking infrastructure. Making use of the run commands to output results to a file for every network device. Utilizing the latest Bolt release to send configuration snippets to Network Infrastructure.