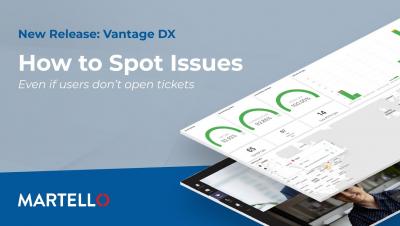
In computing, virtualization is the creation of a virtual — as opposed to a physical — version of computer hardware platforms, storage devices, and network resources. Virtualization creates virtual resources from physical resources, like hard drives, central processing units (CPUs), and graphic processing units (GPUs). By virtualizing resources, you can combine a network of resources into what appears to users as one object.
Over the past few Boot Camps I’ve done since becoming a Head Nerd, automation has been a continuing topic of discussion, and one that brings up various roadblocks. Many of the MSPs that I have talked to one-to-one after the Boot Camps have said they were “embarrassed” to ask more questions about automating their service delivery as they didn’t want their peers “laughing” at them. If you fall into this category, don’t panic!
Monitoring IT infrastructure and services has always been an essential IT prerequisite. However, your IT monitoring system and security measures need to upgrade with an exponential increase in the number of remote users post-pandemic. For instance, consider this: At the end of a work day, you are notified that one of your critical services has gone down. But the problem is that five teams support different processes of that service.
To many engineers, the idea that you can accurately and comprehensively track your application's user experience using just a few simple metrics might sound far-fetched. Believe it or not, there are four metrics that aim to do just that. They're called the four Golden Signals and should be a core part of your observability and reliability practices.
Have you ever experienced the problem where your code is broken in production, but everything runs correctly in your dev environment? This can be really challenging because you have limited information once something is in production, and you can't easily make changes and try different code. Speedscale production data simulation lets you securely capture the production application traffic, normalize the data, and replay it directly in your dev environment. There are a lot of challenges with trying to replicate the production environment in non-prod.
Like most tech companies, we use an on-call rota and various alerting tools. We do this to respond to incidents before they’re reported. Proactively identifying issues and communicating to customers helps us provide great experiences and fosters trust. Internally, we’ve been using these alerting tools in tandem with our auto-create incidents feature. We’ve found that it’s made responding to the pager much smoother - it’s one less thing to do when you get paged at 2am.
This article will give you a quick overview of some of the key attributes you should know in order to get started with leveraging the OpenTelemetry collector for your next telemetry project. As an integral component of any project that involves distributed tracking, the OpenTelemetry Collector plays an important role. Simply put, it is helpful to know that the collector itself is a data pipeline service that collects telemetry data.