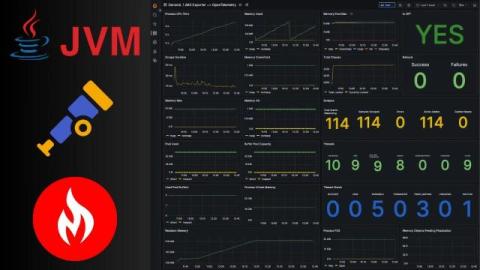
The OpenTelemetry project provides many different components and instrumentations that support different languages and telemetry signals. However, new users often find it hard to pick the right ones and configure them properly for their specific use cases. For this reason, OpenTelemetry defines the concept of a distribution, which is a tailored and customized version of OpenTelemetry components. Here at Grafana Labs, we are all-in on OpenTelemetry.
Many server-side applications are written in Java and often process tens of millions of requests per day. Key applications in various domains like finance, healthcare, insurance and education are often Java-based. When these applications slow down or fail, they affect the user experience and in turn, reduce business revenue. Behind many web forms or form-like GUIs there will often be a Java application.
As the second largest and active Cloud Native Computing Foundation (CNCF) project, OpenTelemetry is well on its way to becoming the ubiquitous, unified standard and framework for observability. OpenTelemetry owes this success to its comprehensive and feature-rich toolset that allows users to retrieve valuable observability data from their applications with low effort. The OpenTelemetry Java agent is one of the most mature and feature-rich components in OpenTelemetry’s ecosystem.
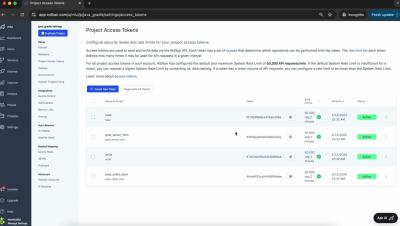
The benefits of automating deployments for your Java Spring Boot application are undoubtable. Not only is it possible to set up images and run tests or compatibility checks before updating the production environment, but CI/CD providers like CircleCI take a step further by streamlining the entire delivery process from code changes to deployment. Many teams assume that the specifics of their development stack or deployment process will make automation difficult to achieve.
In our journeys as developers, we frequently encounter the need for speed and efficiency. But often, integrating development tools can feel like a time-consuming venture, more so than our usual build processes. If you’ve ever found yourself delving into java logs looking for needles in logstacks, you’ll appreciate the beauty of this 1-click OpenTelemetry.
PromCon, the annual Prometheus community conference, is around the corner, and this year I’ll have exciting news to share from the Prometheus Java community: The highly anticipated 1.0.0 version of the Prometheus Java client library is here! At Grafana Labs, we’re big proponents of Prometheus. And as a maintainer of the Prometheus Java client library, I highly appreciate the support, as it helps us to drive innovation in the Prometheus community.