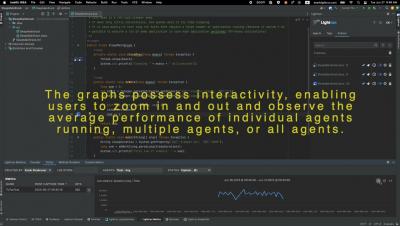
Lightrun Empowers Developers with Next Generation Metric Tools for Java Performance Troubleshooting
When it comes to debugging performance related issues, the range of these issues together with their root cause can be overwhelming to developers.
Just a quick blog to let you know our new whitepaper “How to Get Full-Stack Visibility for Your Java Applications” is now available, download it here: How to Get Full-Stack Visibility for Your Java Applications | White Paper (eginnovations.com).
The Elastic APM Java Agent automatically tracks many metrics, including those that are generated through Micrometer or the OpenTelemetry Metrics API. So if your application (or the libraries it includes) already exposes metrics from one of those APIs, installing the Elastic APM Java Agent is the only step required to capture them. You'll be able to visualize and configure thresholds, alerts, and anomaly detection — and anything else you want to use them for!
IOException is the most generic exception in a large group of Java exceptions that express input/output and networking errors in Java applications.
JMX metrics give solid insights into the workings of your application. Integrating them with Levitate (our time series data warehosue) required us to jump some hoops with vmagent.
The core functionality of the Java Instrumentation API lies in its ability to modify the bytecode of classes being executed by the virtual machine. This capability allows for a range of monitoring tasks to be carried out, such as event recording and data gathering, which can provide valuable insights into an application's performance and behavior.