Operations | Monitoring | ITSM | DevOps | Cloud

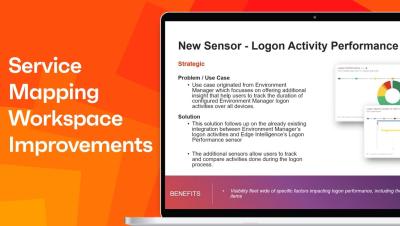
Exploring Enhancements in Service Mapping and Workspace Improvements

The discussion revolves around various enhancements in service mapping, workspace improvements, and app distribution. New connectors like Virima and Ivanti Neurons are being developed for service mapping, along with an outbound connector for ServiceNow. Workspace improvements include filters, remote control, and disabling end user prompts. App distribution introduces features like cloud storage explorer and access to Windows Package Manager. Additionally, role-based permissions for bot triggering and integration of surveys into the overall deck score are being implemented.

One Reason Why Your Nodes' Memory Usage Is Running High

When you’re using Cribl Stream and Cribl Edge to send data to hundreds of Splunk indexers using Load Balancing-enabed Destinations, it is sometimes necessary to analyze memory usage. In this blog post, we delve into buffer management, memory usage calculations, and mitigation strategies to help you optimize your configuration and avoid memory issues.

Observability Unpacked: 5 Takeaways From KubeCon + CloudNativeCon 2024

StackState had a blast at this year's KubeCon + CloudNativeCon gathering in Paris! The discussions were in-depth, covering a wide array of topics and lasting much longer than in the past. This year, attendees seemed to have a considerably deeper understanding of the cloud-native ecosystem, probably attributed to its rapid growth. We also noticed a pretty dramatic evolutionary shift in the vendors at the expo hall, who were showcasing some truly progressive specialized solutions.

Call me, maybe: designing an incident response process

Hey, I just deployed — and this is crazy. But the server’s down, so call me, maybe? Making your services available at all times is the gold standard of modern software operations. The easiest way to reach this would be to just write bug-free software, but even if you reach this completely unattainable goal — stuff happens! Modern software rarely exists in a vacuum and often depends on a multitude of external services and libraries.

How to Configure a Histogram Visualization | Grafana

💡 Do you want to know how and when to use histogram visualizations? Join Senior Developer Advocate Marie Cruz in this beginner-friendly tutorial to learn how to configure a histogram visualization in Grafana. ☁️ Grafana Cloud is the easiest way to get started with Grafana dashboards, metrics, logs, and traces. Our forever-free tier includes access to 10k metrics, 50GB logs, 50GB traces and more.

Charting New Territory: OpenTelemetry Embraces Profiling

The topic of continuous profiling has been an ongoing discussion in the observability world for some time. I said back in 2021 that profiling was set to be the next major telemetry signal in observability, and in fact, since then there’s been growing interest in profiles. Startups and large observability vendors have gotten into this domain. A significant recent step was when the OpenTelemetry project decided to add profiles to its core signals and formalized the open unified specification for that.