Operations | Monitoring | ITSM | DevOps | Cloud

Analytics

There And Back Again: A Honeycomb Tracing Story

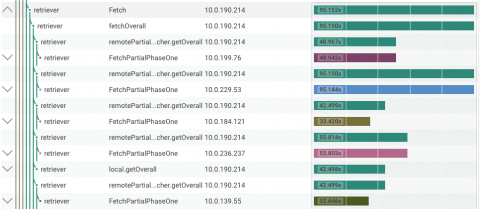
In our previous post about Honeycomb Tracing, we used tracing to better understand Honeycomb’s own query path. When doing this kind of investigation, you typically have to go back and forth, zooming out and back in again, between your analytics tool and your tracing tool, often losing context in the process.

Large-Scale Log Management Deployment with Graylog: A User Perspective

Juraj Kosik, an Infrastructure Security Technical Lead at Deutsche Telekom Pan-Net, has written a detailed case study of how his organization implemented Graylog to centralize log data from multiple data centers exceeding 1 TB/day. His case study provides thorough insights into real-world issues you might run into when implementing and operating a log management platform in a large-scale cloud environment.

Grafana Vs Graphite

The amount of data being generated today is unprecedented. In fact, more data has been created in the last 2 years, than in the entire history of the human race. With such volume, it’s crucial for companies to be able to harness their data in order to further their business goals. A big part of this is analyzing data and seeing trends, and this is where solutions such as Graphite and Grafana become critical.

Level Up With Derived Columns: Understanding Screen Size (With Basic Arithmetic)

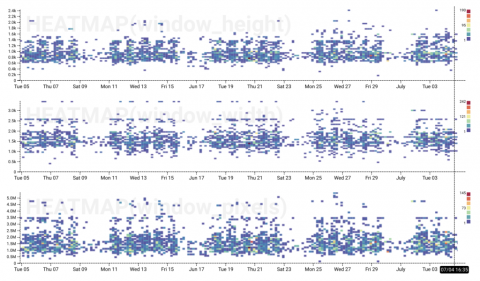
When we released derived columns last year, we already knew they were a powerful way to manipulate and explore data in Honeycomb, but we didn’t realize just how many different ways folks could use them. We use them all the time to improve our perspective when looking at data as we use Honeycomb internally, so we decided to share. So, in this series, Honeycombers share their favorite derived column use cases and explain how to achieve them.

You Can Improve Your Customer Satisfaction Charlie Brown!

What’s surprising to see today is how business operations struggle to get an integrated view of all business metrics. With greater volumes of data being collected, data analysts just can’t keep up with the pace. This state of affairs alone doesn’t hit as hard as the fact that many in data analytics have just come to accept this situation as a norm and simply bear with this daily struggle.

GrafanaCon Recap: The State of TSDB

At GrafanaCon EU, we gathered representatives of the Graphite, Prometheus, InfluxDB, and Timescale projects in the hopes of starting a spirited conversation about the current state of Time Series Databases. They didn’t disappoint! Here are a few highlights from the TSDB panel featuring Erik Nordstrom from Timescale, Dan Cech from Graphite, Paul Dix from InfluxDB, and Tom Wilkie from Prometheus, and moderated by Grafana Labs co-founder and CEO Raj Dutt.

Instrument Your Python App Automatically With The Honeycomb Beeline for Python

We’ve been on a roll this year with Beelines, our integrations for quick, easy, and automagic instrumentation of your apps. You may have already seen our Node.js, Ruby, and Go beelines – today, we’re excited to announce the release of the Honeycomb Beeline for Python!

Benchmarking InfluxDB vs. Elasticsearch for Time Series

In this technical paper, we'll compare the performance and features of InfluxDB 1.4.2 vs. Elasticsearch 5.6.3 for common time series workloads, specifically looking at the rates of data ingestion, on-disk data compression, and query performance. This data should prove valuable to developers and architects evaluating the suitability of these technologies for their use case.