Operations | Monitoring | ITSM | DevOps | Cloud

Analytics

Metrics At Scale: How to Scale and Manage Millions of Metrics (Part 2)

With businesses collecting millions of metrics, let’s look at how they can efficiently scale and deal with these amounts. As covered in the previous article (A Spike in Sales Is Not Always Good News), analyzing millions of metrics for changes may result in alert storms, notifying users about EVERY change, not just the most significant ones. To bring order to this situation, Anodot groups correlated anomalies together, in a unified alert.

The Complete Guide to the ELK Stack - 2018

With millions of downloads for its various components since first being introduced, the ELK Stack is the world’s most popular log management platform. In contrast, Splunk — the historical leader in the space — self-reports 15,000 customers total. But what exactly is ELK, and why is the software stack seeing such widespread interest and adoption? Let’s take a deeper dive.

GrafanaCon Recap: Running a Power Plant with Grafana

A water and energy innovation company founded in 2005, Natel Energy builds hydropower turbines and designs resilient and distributed hydropower systems. In his talk at GrafanaCon EU, Natel Developer Ryan McKinley gave us a fascinating look at how the company is using Grafana to help run these next-generation power plants.

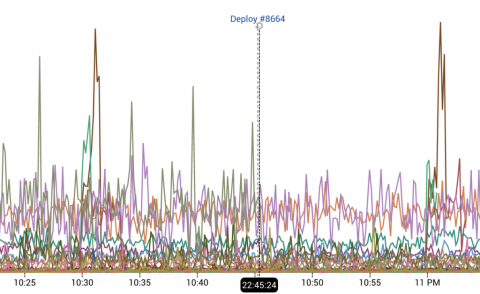
Use New Range Markers to Show The Duration of a State Change

In our world of distributed systems, state changes to your infrastructure often take some time to propagate. With a few exceptions (for example, feature flags), single point in time changes are rare. Deploys, outages, database migrations, failovers, stress tests; none of these things are instantaneous – all have some duration during which the system is changing.