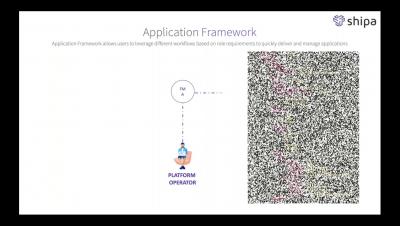
Deploying, Monitoring and Securing Applications on Kubernetes
Learn how deploying, monitoring and securing applications on Kubernetes can be made easy


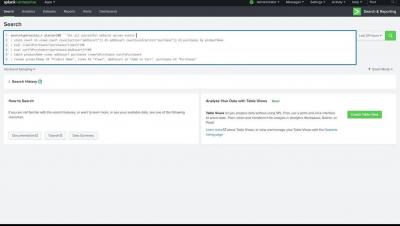
Across the technology and IT infrastructure domain, log files are recognized as often time-stamped files that can virtually record all critical information about events occurring within the purview of your IT network, OS, or other software applications. Some log files are humanly interpretable, while others are largely meant for machines to consume.
Monitoring information that matters to you will often come from disparate sources – whether you are a server engineer, a SQL database administrator, or an application owner wanting a 360 view of your applications’ health. For example, you may want to visualise your server metrics from SCOM alongside historical trends from the SCOM Data Warehouse.
Over the past four days, Grafana Labs' ObservabilityCON 2020 brought together the Grafana community for talks dedicated to observability. We hope you enjoyed all of the sessions, which are available on demand now. (Link to them from the schedule on the event page). The conference wrapped up with predictions and advice from observability experts, lessons in failure, and Grafana Labs team members showcasing ways Grafana and other tools fit into an observability workflow.