Operations | Monitoring | ITSM | DevOps | Cloud

Logging

The latest News and Information on Log Management, Log Analytics and related technologies.

Supercharging Grafana with the Power of Telemetry Pipelines

Grafana is a popular open-source tool for visualizing and analyzing data from various sources. It provides a platform for creating interactive, customizable dashboards that display real-time data in various formats, including graphs, tables, and alerts. When powered by Mezmo's Telemetry Pipeline, Grafana can access a wide range of data sources and provide a unified view of the performance and behavior of complex systems.

Supercharging Elasticsearch with the Power of Telemetry Pipelines

Elasticsearch has made a name for itself as a powerful, scalable, and easy-to-use search and analytics engine, enabling organizations to derive valuable insights from their data in real-time. However, to truly unlock the potential of Elasticsearch, it is essential that the right data in the right format is provisioned to Elasticsearch. This is where integrating a telemetry pipeline can add value to Elasticsearch.

Find connections and expand your data visualization with new dashboards

One of my favorite movies of all time is WarGames, which depicted a teenage hacker accidentally breaking into NORAD and starting a nuclear war simulation that almost turned into a real catastrophe. The movie featured state-of-the-art dashboards (at least for 1983) showing simulated missile launches by different countries. Now you can create Sumo Logic dashboards like the ones shown in this movie using our new Connection Map panel.

7 Quick Tips for Working with Traces in OpenTelemetry

Avoiding vendor lock-in is a ‘must’ when it comes to working with new services. Those in ITOps, DevOps, or as an SRE also don’t want to be tied to specific vendors when it comes to their telemetry data. And that’s why OpenTelemetry’s popularity has surged lately. OpenTelemetry prevents you from being locked into specific vendors for the agents that collect your data.

Monitoring service performance: An overview of SLA calculation for Elastic Observability

Elastic Stack provides many valuable insights for different users. Developers are interested in low-level metrics and debugging information. SREs are interested in seeing everything at once and identifying where the root cause is. Managers want reports that tell them how good service performance is and if the service level agreement (SLA) is met. In this post, we’ll focus on the service perspective and provide an overview of calculating an SLA.

Introducing CrowdStream: A New Native CrowdStrike Falcon Platform Capability Powered by Cribl

We’re excited to announce an expanded partnership with CrowdStrike and introduce CrowdStream, a powerful new native platform capability that enables customers to seamlessly connect any data source to the CrowdStrike Falcon platform.

Getting Data In: 4 Ways to Ingest Data into Splunk

The first step to unlocking the power of Splunk is to get access to your data. No matter what data type or structure it is, Splunk can read it. Watch this video to learn about the four main ways to get your data into Splunk. Including, securely sending lossless data streams by installing the Universal Forwarder on your Linux or Windows host, easily ingesting cloud data sources (e.g., AWS, Azure, and GCP) via Guided Data Onboarding, creating data inputs for virtually any TCP or UDP data traffic, and using the HTTP Event Collector (HEC) to ingest web and app data.

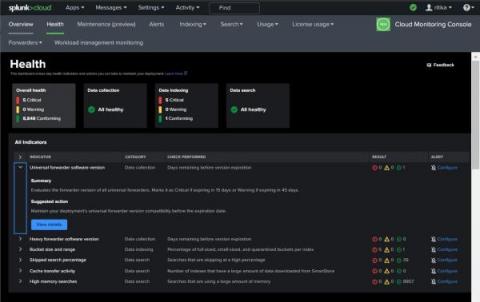
Cloud Monitoring Console's Health Dashboard: Maximize Your Monitoring Efficiency

Are you a Splunk Cloud admin tired of sifting through various tools and dashboards to monitor the health of your Splunk Cloud deployment? Do you often find yourself wondering what actions you can take to keep your Splunk Cloud deployment running smoothly? Are you looking for ways to be alerted before something impacts your deployment performance? Look no further than the Cloud Monitoring Console's Health Dashboard!

How the All-In Comprehensive Design Fits into the Cribl Stream Reference Architecture

Join Cribl's Ed Bailey and Ahmed Kira as they provide more detail about the Cribl Stream Reference Architecture, which is designed to help observability admins achieve faster and more valuable stream deployment. During this live stream discussion, Ed and Ahmed will explain the guidelines for deploying the comprehensive reference architecture to meet the needs of large customers with diverse, high-volume data flows. They will also share different use cases and discuss the pros and cons of using the comprehensive reference architecture.