Operations | Monitoring | ITSM | DevOps | Cloud

Observability

The latest News and Information on Observabilty for complex systems and related technologies.

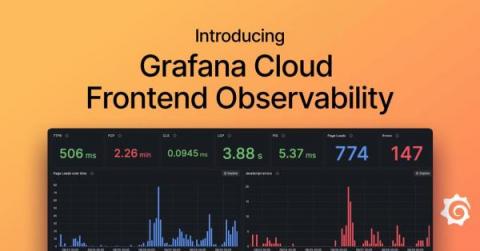
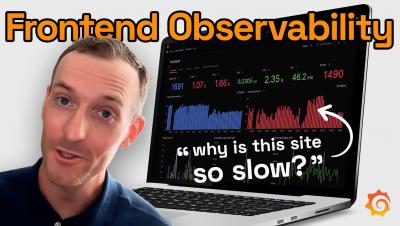
Real user monitoring in Grafana Cloud: Get frontend error tracking, faster root cause analysis, and more

The frontend of a web application is the part that users directly interact with. It’s the last mile of the digital service you deliver to your customers and it’s directly associated with customer satisfaction and business objectives. Knowing performance metrics such as CPU or memory is helpful, but at the end of the day, what you care most about is if the user experience is affected.

The Hidden Challenges of Troubleshooting Legacy and Monolithic apps in Production

Debugging in production is always a necessary evil. No matter how well your code is written and reviewed, bugs are bound to appear, and their consequences are there for your users to see. While debugging any app has challenges, debugging legacy systems is a different ballgame. From unfamiliarity with the codebase to a lack of knowledge about the tech, your developers can find themselves aimlessly searching for solutions where solutions don’t exist.

AppDynamics Cloud is now Cloud Native Application Observability, powered by the Cisco Full-Stack Observability Platform

AppDynamics Cloud is now Cloud Native Application Observability powered by Cisco Full-Stack Observability (FSO) Platform. With Cisco FSO Platform extensibility, the introduction of new modules will extend observability use cases supported by Cloud Native Application Observability. In addition, we are expanding our Multi-Cloud Observability strategy to include visibility into Google Cloud Platform with this release.

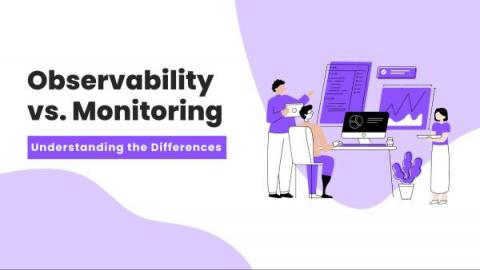
Observability vs. Monitoring: Understanding the Differences

This post was written by Siddhant Varma. Scroll down to read the author’s bio. Software development isn’t just about building and deploying software. There’s a wide range of operations and activities you need to tackle even after you’ve successfully deployed it. The two most common are observability and monitoring. While they’re similar in a lot of ways, it’s important to understand that they are not exactly the same, and each has its own purpose.

Evolving by Involving

The customer success department at Honeycomb features a number of different roles dedicated to helping our customers succeed in every step of their observability journey. The work we do ranges from support engineers who provide timely assistance to customers, to customer architects who dive deep into the technical stuff, to product training who educate folks on features old and new.

Observability-Driven Development Explained: 8 Steps for ODD Success

As companies embrace containers, microservices, and complex architectural components, systems have grown more and more distributed and unpredictable, increasing the unknown unknowns. How can organizations remain efficient and effective in this type of intricate environment? With observability-driven development.

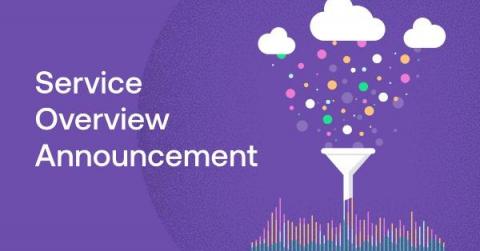
Unify Infrastructure and Application Observability with Logz.io's Service Overview

Logz.io is excited to announce Service Overview, a fast and easy way to unify telemetry data and insights across your infrastructure and applications into a single interface. Our Beta users have reported simplified observability, faster time-to-insights, and observability consolidation.

Observing Core Web Vitals with OpenTelemetry

Core Web Vitals (CWV) are Google's preferred metrics for measuring the quality of the user experience for browser web apps. Currently, Core Web Vitals measure loading performance, interactivity, and visual stability. These are the main indicators of what a user’s experience will be while using a web page.