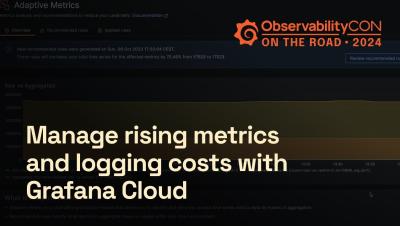
Operations | Monitoring | ITSM | DevOps | Cloud

The latest News and Information on Monitoring for Websites, Applications, APIs, Infrastructure, and other technologies.

What Causes High Latency in Networks: The Silent Speed Bumps on Your Digital Highway

Have you ever felt like you're stuck in digital rush hour? You click on a link, and the page takes an eternity to load. A video call turns into a frustrating slideshow of frozen frames. These experiences can be incredibly disruptive, and the culprit is often a hidden enemy known as latency. Think of your network as a highway for information. Latency is like a speed bump that disrupts the smooth flow of data.

How eG Enterprise solves uncertainty and challenges in the world of hypervisors and virtualization migration

In a recent blog article, we covered how the license changes for VMware virtualization may impact many of our partners and customers and are driving uncertainty in the market and causing many to consider their virtualization migration strategy, see Will Broadcom’s plans for VMware affect you? | eG Innovations.

Save up to 14 percent CPU with continuous profile-guided optimization for Go

We are excited to release our tooling for continuous profile-guided optimization (PGO) for Go. You can now reduce the CPU usage of your Go services by up to 14 percent by adding the following one line before the go build step in your CI pipeline: You will also need to supply a DD_API_KEY and a DD_APP_KEY in your environment. Please check our documentation for more details on setting this up securely.

Launching Resource Performance Monitoring

What is the slowest part of your website? Most of the time, it’s the resources: all the CSS, fonts, images, and JavaScript that powers your webpage. Resources that are too big or too slow are often the root cause of slow Core Web Vitals. This week, we’re releasing a bunch of new tools and reports to better understand your web resources, how they impact your website performance, and where you have opportunities to improve.

Datadog vs Grafana: Comparison Guide 2024

Monitoring tools are essential for maintaining stability and performance. They enable organizations to monitor diverse metrics, analyze trends, and identify anomalies to prevent downtime and maximize resource efficiency. Among the leading solutions in this domain, both Datadog and Grafana are recognized for their effectiveness and versatility. Understanding the nuances between these platforms is vital for businesses to make informed decisions about which tool best suits their needs.

Grafana Enterprise data source plugins: A brief guide to what they are and how to get started

One of the most powerful features of Grafana is the ability to unify and derive value from your data, regardless of where that data lives. This is because we’re fully committed to making Grafana an open, composable, and extensible observability platform for our more than 20 million users worldwide. But how exactly do we deliver on that promise of openness and extensibility? Grafana data source plugins play a big role.