Operations | Monitoring | ITSM | DevOps | Cloud


The latest News and Information on Log Management, Log Analytics and related technologies.

What is an Observability Engineer?
What is an observability engineer? Is it your SIEM admin? How about your application performance monitoring admin? Neither? Both? Observability engineering is more than administering a tool. There is more to it than data onboarding, writing parsers, and getting data in. As an observability tool admin, you work with data producers and consumers to get data in a human-readable and searchable format from the source to the analytics system.

OpenTelemetry Workshop
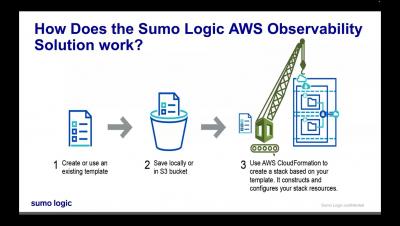
Adding a Service to AWS

Mind the Overspray - Password Spraying Remains a Major Threat
If you’re wondering if that classic car you’ve been scoping out on Bring a Trailer or eBay Motors is as authentic as posited by the seller – specifically re: the common claims of “original paint” or “high quality respray” – you’re going to want to take a closer look around the edges. This is because a talented painter can make a second or 30th-hand vehicle look pretty snazzy with a well-affected, if not super high-quality, repaint.
Demystifying Observability and Making it Work for You
This article is the final installment in a series that demystifies observability. The first three focused on the history of observability, dispelling myths around observability, and what observability is and what it can offer. In this last article of the series (Check out part 1), I want to offer a complete definition of observability.
UiPath Robotic Process Monitoring for Splunk - Demo Walkthrough

Introducing Cloud Logging - Log Analytics, powered by BigQuery
Logging is a critical part of the software development lifecycle allowing developers to debug their apps, DevOps/SRE teams to troubleshoot issues, and security admins to analyze access. Cloud Logging provides a powerful pipeline to reliably ingest logs at scale and quickly find your logs. Today, we’re pleased to announce Log Analytics, a new set of features in Cloud Logging available in Preview, powered by BigQuery that allows you to gain even more insights and value from your logs.

How to Scale Your Alerts Beyond PromQL with Coralogix Flow Alerts
When building alerts, engineers aim to create accurate, timely, and actionable alerts. In pursuit of this goal, many engineers will leverage PromQL throughout their careers. PromQL is the query language used by Prometheus and Alert Manager to query metrics and define alerting rules. While PromQL works very well for simple use cases, as infrastructure scales, architectural patterns grow more complex, engineering practices accelerate, and alerting use cases become more multivariate.

Why You Need Synthetic Monitoring
Synthetic monitoring can be one of the most powerful tools in your DevOps team’s toolkit, especially for the SRE, yet is one that is often overlooked by people building out a reliability mindset. Synthetic monitoring permits you to simulate any transaction or interaction users can have in your website or app, from places around the world, as often as you’d like.