Operations | Monitoring | ITSM | DevOps | Cloud

Logging

The latest News and Information on Log Management, Log Analytics and related technologies.

Is Operational Resilience in Financial Services actually just a data problem?

Operational resilience is currently a hot topic in Financial Services, largely because of the impact that COVID has had on how customers interact with financial institutions. Almost overnight, the financial services industry had to cope with a large volume of transactions moving to digital channels at the same time as its employees were forced to set up home offices so that they could continue to work remotely.

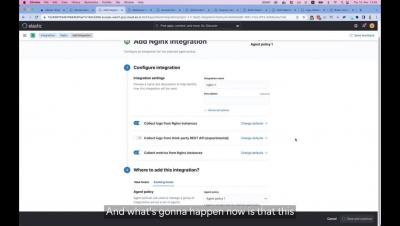
Easily ingest data to Elastic via Splunk

As organizations migrate to Elastic from incumbent vendors, quickly onboarding log data from their current solution into Elastic is one of the first orders of business. Data onboarding often involves having to adjust ingestion architecture and implement configuration changes across data sources. We want to ensure that users trialing or migrating to Elastic can get data in quickly to start seeing the power of Elastic solutions as quickly as possible.

New in Kibana: How we made it easier to manage visualizations and build dashboards

Our Kibana team has been hard at work implementing and executing on a new Kibana strategic vision to streamline the dashboard creation process and sand down the rough edges of creating visualizations for dashboards. We accomplished our goal and reduced the overall time it takes users to go from a blank slate to a meaningful dashboard that conveys insights about the data.

Using pre-built Monitors to proactively monitor your application infrastructure

SREs, developers and DevOps staff for mission-critical modern apps know being notified in real-time when or before critical conditions occur can make a massive difference in end-user digital experiences and in meeting a 99.99% availability objective.

The Spike Protection Bundle with Index Rate Alerting

For DevOps teams that want to accelerate release velocity and improve reliability, logs can unlock the insights you need to move faster. But for managers and budget owners, logging can be an unpredictable pain. Trying to estimate logging spend, especially with the adoption of microservices and container-based architecture, seems like an impossible task.

Announcing LogDNA Agent 3.2 GA: Take Control of Your Logs

The LogDNA Agent is a powerful way for developers and SREs to aggregate logs from their many applications and services into an easy-to-use web interface. With only 3 kubectl commands, the installation process is quick and simple to complete for any number of connected systems. To help control the logs that are stored and surfaced in the LogDNA web interface, users can set Exclusion Rules, which enables the exclusion of certain queries, hosts, and tags directly from the UI.

LogDNA | Log Management for DevOps

LogDNA is a modern log management solution that empowers DevOps teams with the insights that they need to develop and debug their applications with ease. Users can get up and running in minutes, see logs from any source instantly in Live Tail, and effortlessly search them with natural language. Custom Parsing, Views, and Alerts put users in control of their data every step of the way.