Operations | Monitoring | ITSM | DevOps | Cloud

Latest News

Alert fatigue, part 1: avoidance and course correction

Alert fatigue occurs when one is exposed to a large number of frequent alarms (alerts) and consequently becomes desensitized to them. This problem is not specific to technology fields: most jobs that require on-call, such as doctors, experience it in slightly different manners, but the problem is the same.

Sentry + Microsoft Azure DevOps: Error-Tracking, Crash-Reporting, & More

Sentry is updating our key integrations for Azure DevOps (formerly VSTS). With these tightly-woven integrations, developers (like you) can unlock enhanced release tracking, informative deploy emails, and assignee suggestions for new errors. Route alerts to the right person based on the Azure DevOps commit that caused the issue, cutting remediation time to five minutes.

ManageEngine Strengthens Endpoint Security with the Launch of Browser Security Plus at London User Conference

LONDON - Sept. 18, 2018 - ManageEngine, the real-time IT management company, today announced its launch of Browser Security Plus, a browser management solution that helps organisations secure their corporate data in the cloud and protect their networks from web-based cyberattacks. Available immediately, Browser Security Plus provides organisations with a layer of management capabilities for browsers and their add-ons to maintain robust enterprise security.

Connect Insights to Real-Time Action With PagerDuty Visibility

Have you ever gotten that dreaded text from your boss: “The site is down”? Maybe you were meeting with a customer. Or having dinner with your family. Maybe you were presenting at a conference. Doesn’t matter. Whatever else you were doing, now you’re doing emergency incident communication too. You check in with your team leads and confirm there is a problem. You let your boss know the response is under way.

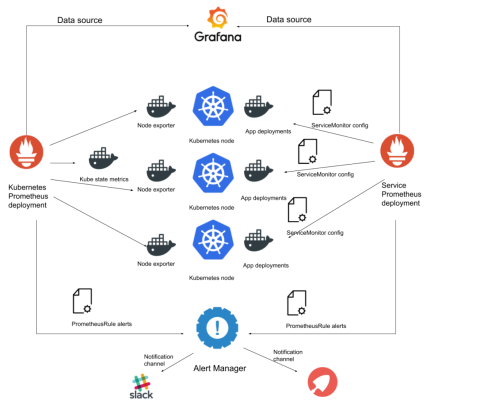
Kubernetes monitoring with Prometheus - Prometheus operator tutorial (part 3).

We covered how to install a complete ‘Kubernetes monitoring with Prometheus’ stack in the previous chapters of this guide. But using the Prometheus Operator framework and its Custom Resource Definitions has significant advantages over manually adding metric targets and service providers, which can become cumbersome for large deployments and doesn’t fully utilize Kubernetes’ orchestrator capabilities.

How IT Pros Can Maximize Efficiency With Uptime.com

IT professionals have to efficiently manage several dozen to several hundred critical pieces of infrastructure a modern business needs to stay afloat. Even smaller businesses often encounter this challenge. We understand that at every level, the time spent researching these issues comes at a cost. That’s why we’ve built some time-saving measures into Uptime.com to help you make more efficient use of your most precious resource: your time.

Monitoring Kafka in Production

Franz Kafka was a German-speaking Bohemian Jewish novelist and short story writer, widely regarded as one of the major figures of 20th-century literature. Apache Kafka, on the other hand, is an open-source stream-processing software platform. Due to its widespread integration into enterprise-level infrastructures, monitoring Kafka performance at scale has become an increasingly important issue.

Icinga 2 DSL Feature: Namespaces coming in v2.10

Under the hood, Icinga 2 uses many constants and reserved keywords, e.g. “Critical” or “Zone” which are respected by the config parser and compiler. This sometimes leads to errors when users accidentally override such things, or re-define their own global constants. v2.10 introduces namespaces for this purpose, and ensures that such accidents won’t happen anymore.