Operations | Monitoring | ITSM | DevOps | Cloud

Latest News

Intro to NGINX

If you've been following along with my posts, you have a sound introduction to Apache Web Server, how it functions, it's place in history, and how Sumo Logic can help you sort through the numerous logs provided. Apache Access and Error logs are integral to understanding the traffic patterns and issues your users face when accessing your web applications. Sumo Logic helps administrators parse through logs, isolate issues, and determine the root causes of errors.

OnPage and ConnectWise: Incident Alert Management Workflows

Let’s set the scene: You’re an on-call engineer, working for a dedicated support team. Your priorities are twofold, including, (1) speedy incident resolution and (2) satisfying clients and stakeholders. With these demands in mind, you adopt OnPage’s integration with ConnectWise. The integration streamlines the ticketing-to-alerting process, ensuring that your team achieves client service excellence.

17 Tech Support Tickets You'll Be Happy You Didn't Receive

If tech support had a motto, it’d be reminiscent of Rule #4 of the Auvik Way: Even when it’s not your fault, it’s your problem. But sometimes, there are problems so bad you wouldn’t want to deal with them. We’ve rounded up 17 examples from the r/techsupportgore subreddit that are sure to send a palm to your face and a shiver down your spine: Plugging in your USB receiver with a hammer for that flush mounted look. from r/techsupportgore Good luck getting that one out.

Top 3 Reporting Software of 2019

Reporting software is a part of a Business Intelligence or BI suite and is used for analysis in early data processing. The purpose of self-service reporting software is to help deliver interactive information that can be put into action. Self-service reporting software allows the user to connect data sources, extract data and present it in various formats of visualization, including charts, tables, and spreadsheets.

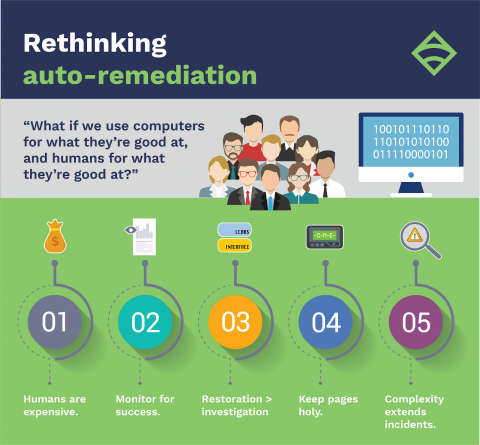
Demonware's journey to assisted remediation

At Monitorama 2018, Engineering Manager Kale Stedman shared Demonware’s journey to assisted remediation, or as he likes to call it: “How my team nearly built an auto-remediation system before we realized we never actually wanted one in the first place.” In this post, I’ll recap Kale’s Monitorama talk, highlighting the key decisions that helped his team reduce daily alerts, fix underlying problems, and establish a more engaged Monitoring Team — including the steps the

The Complete Guide to Azure Monitoring

Monitoring an Azure environment can be a challenging task for even the most experienced and skilled team. Applications deployed on Azure are built on top of an architecture that is distributed and extremely dynamic. But all is not doom and gloom. Azure users have a variety of tools they can use to overcome the different challenges involved in monitoring their stack, helping them gain insight into the different components of their apps and troubleshoot issues when they occur.

Understanding Heroku Error Codes with Scout APM

If you are hosting your application with Heroku, and find yourself faced with an unexplained error in your live system. What would you do next? Perhaps you don’t have a dedicated DevOps team, so where would you start your investigation? With Scout APM of course! We are going to show you how you can use Scout to find out exactly where the problem lies within your application code.

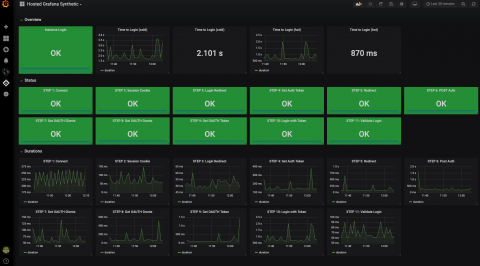
Grafana Tutorial: Simple Synthetic Monitoring for Applications

Often there’s a focus on how a service is running from the perspective of the organization. But what does service health monitoring look like from the perspective of a user? There are many metrics that indicate the overall health of a container, vm, or application, but independently they do not indicate if the system is functioning correctly. Often these metrics (CPU, disk, memory) are too narrow, and they can be poor indicators. High CPU may be desirable or bursts of memory usage may be normal.