Operations | Monitoring | ITSM | DevOps | Cloud

9 tips for keeping down cloud expenditure

At first, the benefits of public cloud adoption are clearly recognisable: newfound agility through an all-you-can-eat and on demand buffet of services, platforms, and infrastructure. But without appropriate monitoring, guardrails and process changes, this can change fast. While the perception is that cloud offers unlimited scalability and lower costs by only charging for the resources you use, the truth is that customers pay for the resources they order, whether they use them or not.

How to monitor web servers and their performance

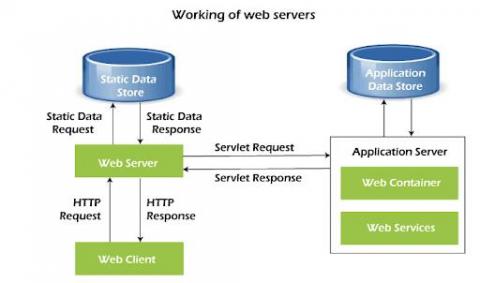
Web servers are among the most important components in modern IT infrastructures. They host the websites, web services, and web applications that we use on a daily basis. Social networking, media streaming, software as a service (SaaS), and other activities wouldn’t be possible without the use of web servers. And with the advent of cloud computing and the movement of more services online, web servers and their monitoring are only becoming more important.

Debugging Just Got Faster and Easier With New Enhancements to BubbleUp

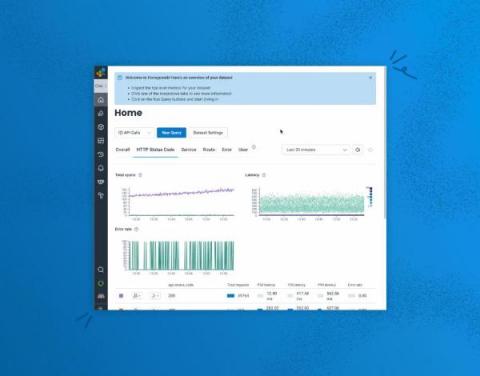
BubbleUp is Honeycomb’s machine-assisted debugging feature and is one of our most powerful differentiators. It leverages machine analysis to cycle through all of the attributes found in billions of rows of telemetry to surface what is in common with problematic data compared to baseline data. This explains the context of anomalous code behavior by surfacing exactly what changed when you don’t know which attributes to examine or index, dramatically accelerating the debugging process.

Grafana 9.2 release: Troubleshooting Grafana panels with a new support feature

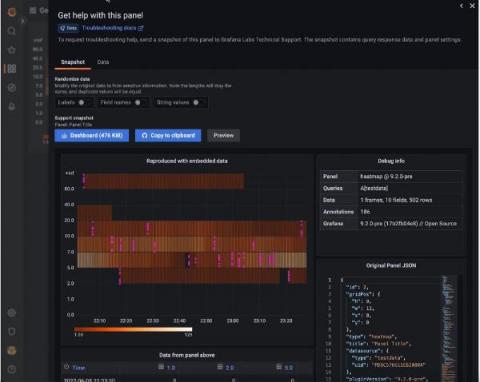
Ever run into issues building a panel in your Grafana dashboards? To help with those issues, the current support process for Grafana, Grafana Cloud, and Grafana Enterprise often requires many cycles where we request more information. This can be slow, frustrating for both our users and our support teams, and the process makes it difficult to reproduce issues without access to similar data.

The modern incident management software stack

We’re fortunate enough to speak to a huge number of companies about their incident management processes. In doing so, we’ve noticed an emergent trend in how modern companies are using software to support their incident management processes, and a common set of challenges faced by them too.

Autoscaling Checkly Agents with KEDA in Kubernetes

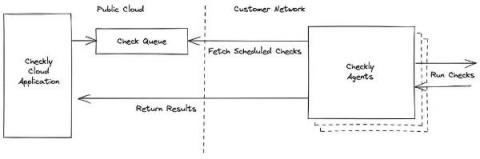
Checkly private locations enable you to run browser and API checks from within your own infrastructure. This requires one or more Checkly agents installed in your environment where they can reach your applications and our Checkly management API. You need to ensure you have enough agents installed in order to run the number of checks configured in the location. We have a guide to planning for redundancy and scaling in our documentation.

Where Are You In Your Observability Journey?

Observability is the ability to see and understand the internal state of a system from its external outputs. Logs, Metrics, and Traces, collectively called observability data, are three external outputs widely considered to be three pillars of observability. Now more than ever, organizations of all sizes must employ the necessary processes and technologies to harness the power of their data and make it more actionable.

How to monitor HTTP endpoints

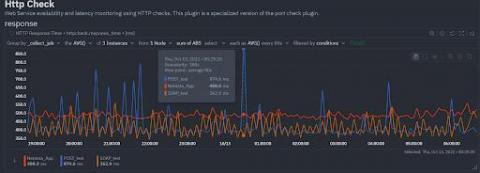
The HTTP protocol has become the de facto standard application layer protocol of the internet. From publicly available web sites and APIs to “inter-process” communications in REST based microservice architectures or large Service Oriented Architectures based on SOAP, you find HTTP being used again and again, due to its simplicity and our familiarity with it. How many protocols can you name that have memes for their status codes?