What's new Pandora FMS 752
Let’s check out together the new features and improvements for Pandora FMS new release: Pandora FMS 752.


Let’s check out together the new features and improvements for Pandora FMS new release: Pandora FMS 752.
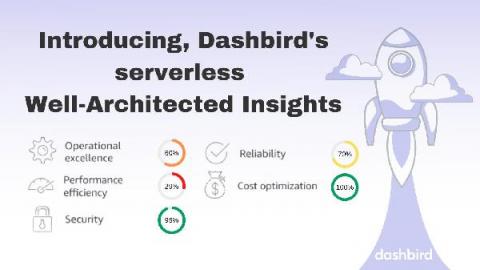
Dashbird now scans your serverless infrastructure for industry best practices. It’s the antidote for chaos. We’re excited to introduce the Dashbird Well-Architected Insights – a continuous insights scanner combined with Well-Architected reports. The new feature provides serverless developers with insights and recommendations to continually improve their applications and keep them secure, compliant, optimized, and efficient.
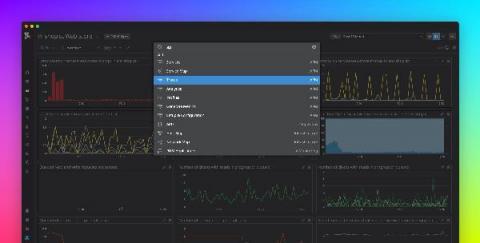
Datadog’s features give you full visibility into every part of your application environment, so it’s likely you have many resources to switch between as part of your troubleshooting and development workflows. For example, you might switch from the host map to investigate a performance issue with your services in APM, or jump between dashboards to correlate metrics and troubleshoot a problem with your CI/CD pipeline.
We are pleased to announce the immediate availability of a new update (8.7.3) for the Alloy Software ITSM/ITAM platform, including Navigator, Navigator Express, and Discovery. This maintenance update resolves issues reported in previous versions, offers Apple M1 Chip support, and expands API integration capabilities. For detailed information about all changes in this update, please see Release Notes on the Alloy Documentation Portal.
The Sensu Puppet module has seen another major release up to 5.x to coincide with the release of Sensu Go 6. The 5.0.0 bump for the Sensu Puppet module was a chance for us to introduce new features to better support Sensu Go 6, as well as remove code that had been deprecated and no longer needed.
AWS Lambda has become a core technology in the shift to cloud-native application development, eliminating infrastructure management and fixed costs. But there are trade-offs with serverless environments. Not having access to the production infrastructure can make debugging difficult and there are a lot of moving parts, adding distributed complexity. Monitoring serverless functions in production requires observability beyond CloudWatch logs and metrics.
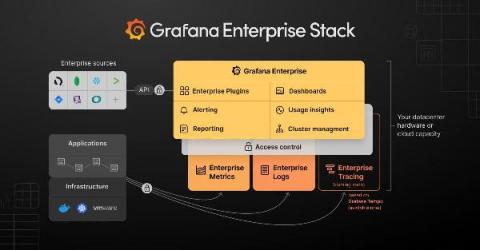
Today, we are launching a new Grafana Labs product, Grafana Enterprise Logs. Powered by the Grafana Loki open source project for cloud native log aggregation, and built by the maintainers of the project, this offering is an exciting addition to our growing self-managed observability stack tailored for enterprises.
Mattermost v5.32 is generally available today. The new feature release offers the following new features (see changelog for more details).
We are excited to introduce Calico Cloud, a pay-as-you-go SaaS platform for Kubernetes security and observability. With Calico Cloud, users only pay for services consumed and are billed monthly, getting immediate value without upfront investment.
We are excited to announce the new Elastic Cloud usage analysis page. You can now explore and analyze your Elastic Cloud usage to better understand how the resources you consume contribute to your monthly bill. Your Elastic Cloud monthly bill consists of usage fees for the resources you used, including: Understanding your resource utilization allows you to make smarter decisions about your Elastic deployments as well as identify areas where you may be able to save costs.