Operations | Monitoring | ITSM | DevOps | Cloud

The latest News and Information on Observabilty for complex systems and related technologies.

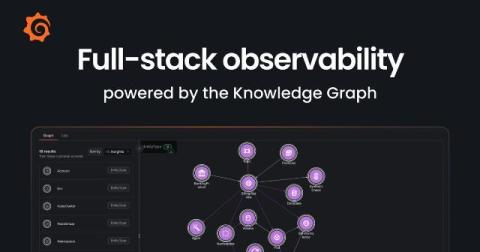
Full-stack observability in Grafana Cloud: More connections, richer context, and faster investigations for users and agents

Most teams have telemetry from across their stack, but connecting those signals to understand what's happening and how it affects users isn't always easy. Critical context about service dependencies, ownership, and past incidents often lives across tools, runbooks, and conversations between team members. That’s why, today at ObservabilityCON 2026, we’re announcing new capabilities that advance full-stack observability across Grafana Cloud.
Observability Lessons NVIDIA and CoreWeave

The best thing that can happen to an open-source project is to find its way into some of the world’s largest technology companies. In September 2026, this happened twice in one week: VictoriaMetrics is now officially bundled in the self-managed edition of NVIDIA’s Cloud Functions, and I learned that CoreWeave is using VictoriaMetrics as the metrics backend for all of its infrastructure customers. Both companies adopted VictoriaMetrics independently.

Modal scales the next generation of AI with unified observability from Datadog

Modal is an AI infrastructure company rebuilding the cloud for AI, giving developers easy access to the compute needed to build and scale AI applications without managing the underlying complexity. Operating across more than 20 cloud providers and launching approximately 26 million containers daily, Modal relies on Datadog to unify observability across its infrastructure, applications, networking, and CI—helping its engineers detect 99% of incidents within five minutes, resolve 96% of issues before customer impact, and confidently scale one of the world’s most complex AI platforms.

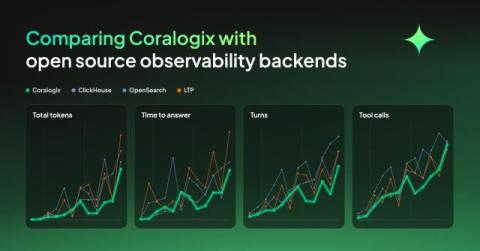
Comparing Coralogix with open source observability backends

We put the same OpenTelemetry data into four backends, Coralogix, ClickHouse, OpenSearch and a Loki, Tempo and Prometheus stack, then set an agent twelve questions against each one, from counting spans to working out what is wrong in a system it has never seen. Then we forced the agents to continue investigating until they got to the right answer. In this experiment, what separated them was the time, tokens, tool calls and turns it took to get there.

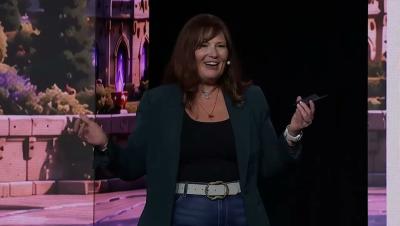
CriblCon 26 Keynote highlights: Cribl StreamAI, App Framework, Marketplace, and Detect

This CriblCon 26 keynote highlight reel introduces Cribl’s AI platform for telemetry and highlights Cribl StreamAI, the Cribl App Framework, Cribl Marketplace, and Cribl Detect. It is relevant to IT, security, and observability teams exploring intelligent model routing, agentic app development, marketplace deployment, and security investigations using telemetry and context. The keynote also covers the SEC IT benchmark, the cost of investigating incidents with different AI models, and included inference for Cribl-native workloads.

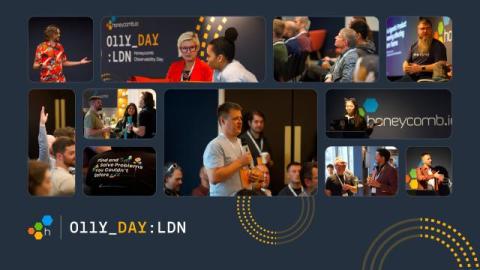
Everything We Talked About at O11yDay London 2026

We just wrapped O11yDay London, and one theme ran through every session: writing code is no longer the hard part. Review queues, attention, operating agents in production, runaway token bills, and proving any of it is worth the money are where teams are getting stuck. The teams making progress are the ones who can see what's happening in production. Here are some highlights. We'll have videos available in the near future.

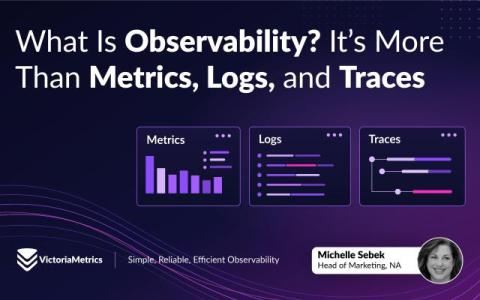
What Is Observability? It's More Than Metrics, Logs, and Traces

Modern systems, due to their distributed nature, rarely fail in simple ways. A request might pass through an API gateway, several microservices, a database, a message queue, and a third-party service before a response ever reaches a user. When something slows down or breaks, knowing that something is wrong is only the beginning. You need to figure out.

Get observability in your pocket with the Grafana mobile app

When you’re on the go, your phone is often the only observability tool you have. And what you can do with it in the first few minutes matters. With the incredible innovation that has gone into mobile CPUs, GPUs and displays, a phone is a powerful device where you can immediately see what’s happening and start acting on it. And the Grafana mobile app now allows you to both see and act.

Best AI Observability Tools of 2026: Monitoring the AI You Build and the AI That Runs Your Ops

TL;DR “AI observability” now describes two different jobs. One is watching the LLM apps and AI agents your team ships: prompts, tool calls, token spend, and output quality. The other is putting AI agents to work on your production telemetry so incidents are already being investigated by the time an engineer logs in. Most engineering orgs in 2026 need both, and very few tools cover the two well.