Operations | Monitoring | ITSM | DevOps | Cloud

The latest News and Information on Monitoring for Websites, Applications, APIs, Infrastructure, and other technologies.

Key metrics for Elasticsearch performance monitoring

Elasticsearch is a highly scalable, distributed, open-source RESTful search and analytics engine that offers log analytics, real-time application monitoring, click stream analytics, and more. Elasticsearch stores and retrieves data structures in real time. It has multi-tenant capabilities with an HTTP web interface, presents data in the form of structured JSON documents, makes full-text search accessible via RESTful API, and maintains web clients for languages like PHP, Ruby, .Net, and Java.

Monitoring Java using JMX and custom metrics

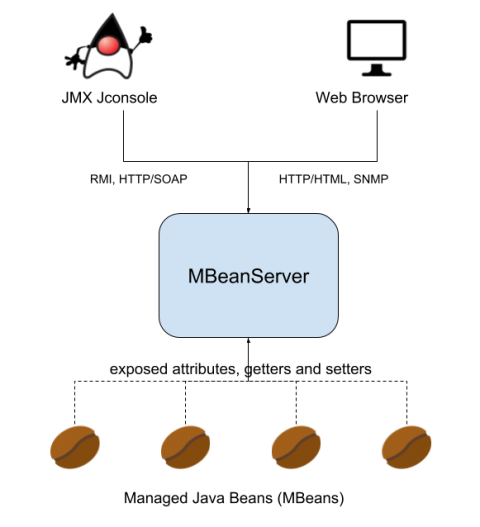
JMX (Java Management Extensions) is a set of specifications conceived to monitor and manage Java applications. To implement the JMX technology, you need to create and register MBeans (Managed Beans) as part of your Java code. Using JMX technology and tools, Java application developers can get the dynamic state of the application and use it for performance tuning, troubleshooting and debugging.

Monitor your domain, SSL certificate, blacklists and robots.txt

Super Monitoring introduced a new type of check: “Daily Health”, which checks once a day the domain and SSL certificate’s expiration dates, the validity of the certificate, presence of the site on blacklists and detects whether the website is blocking search engine robots.

Agile and DevOps: great union for IT

It’s been some time since devops and agile to walk side by side. Combining both has become the basic precept for any IT area, since that way you can get better business results. However, this union still generates much discussion. To better understand the two concepts, it is interesting to note that all of DevOps’ efforts within an organization are geared towards enabling “value delivery” to customers and businesses as quickly as possible.

NIF, World's Largest Laser and Splunk

When you work with the world’s largest laser, you need secure and reliable IT Infrastructure. The National Ignition Facility uses Splunk Enterprise and Splunk IT Service Intelligence (ITSI) to improve control systems reliability, maximize system uptime and performance and proactively monitor and respond to IT and security challenges.

5 Easy Ways to Improve Site Speed

When it comes to loading time, every second counts. In fact, studies show people will never return to your site if it takes longer than a couple of seconds to load. Site speed should be high on your list of performance improvements. On the internet, you really do only get one chance to make a first impression. That’s why speed testing is so important, but it shouldn’t stop at the development phase. Site speed should be continually monitored every step of the way.

Top 3 AWS Lambda Performance Monitoring Tools

Serverless is often described as the abstraction to end all abstractions. VMs and standalone containers pale in comparison stateless functions. That pristine distinction between the application’s code and its stateful data is something we all dream of. Scalability, observability and high availability can now be realized on a global scale.