Operations | Monitoring | ITSM | DevOps | Cloud

The latest News and Information on Monitoring for Websites, Applications, APIs, Infrastructure, and other technologies.

Monitoring Pi-hole: Having your Raspberry Pi, and eating it with Prometheus remote write!

Last year we cooked a holiday ham using Sysdig. Honestly, just revisiting that makes me hungry, but it got me thinking. What about dessert? Today, I’d like to discuss baking a pie and eating it with Prometheus Remote Write. But not just any pie: a Raspberry Pi. Specifically, I’d like to introduce you to Pi-hole, an open-source project that has become very popular in the community. In this article you’ll learn how easy is Monitoring Pi-hole with Prometheus Remote Write.

Sysdig offers remote write and more custom metrics for its managed Prometheus service

We are excited to announce that Prometheus Remote Write functionality is now generally available in Sysdig Monitor. This feature allows Prometheus users to easily push metrics directly from their Prometheus servers to Sysdig’s Managed Prometheus Service. Sysdig Monitor provides not only a scalable long term storage solution for custom metrics but also radically simplifies Prometheus monitoring.

The latest Github outage and how it impacts observability

Every now and then, issues occur that disrupt the very fabric of global software engineering. Chief amongst them is the recent mass outage of Github. Github is a fundamental building block in software productivity, hosting over 190 million code repositories. Github hosts our code and libraries, runs build pipelines, and much more. It is a central hub of activity and it is consumed by tens of thousands of organizations.

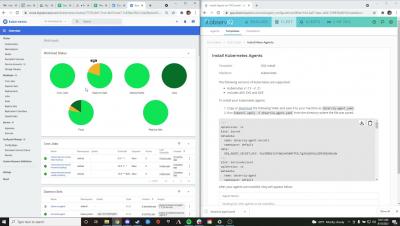
Prometheus monitoring with Sysdig

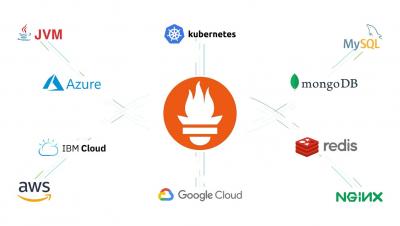
Prometheus is the de-facto standard for monitoring Kuberentes and cloud-native applications. However, as your Prometheus environment grows, it gets more and more complicated to use and maintain. Prometheus exporters need to be selected, installed, configured, and updated. And PromQL has a steep learning curve. How can you focus on your business, instead of building a monitoring solution?

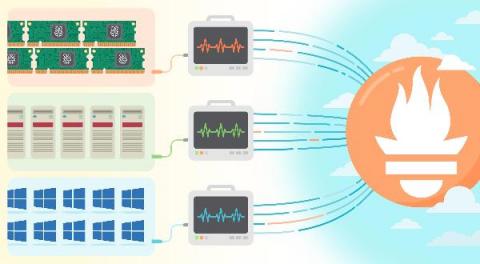
How to dynamically monitor disks in Windows with Pandora FMS

In this tutorial we're going to see how easy it is to dynamically monitor the disks of our Windows machines with Pandora FMS. To do this, we only need to have the software agent installed on these devices and use the agent plugins that are already loaded by default. We will find two options, to obtain the free space in the disks or the possibility of monitoring the occupied space in these disks. occupied on the disks.

Distributed tracing with OpenTelemetry and Cloud Trace

As more services are involved in serving user traffic and completing transactions, how does each service contribute to overall latency? In this episode of Engineering for Reliability, we’ll show how to use distributed tracing to capture the latency of user requests and how long it takes each service in the path to return a response. Watch to learn how to capture latency in distributed applications using OpenTelemetry and analyze it using Cloud Trace.

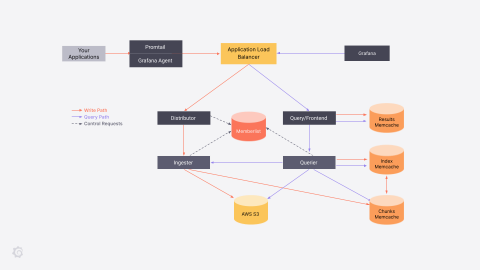
A guide to deploying Grafana Loki and Grafana Tempo without Kubernetes on AWS Fargate

At Seniorlink, we provide services and technology to support families caring for their loved ones at home. In the past two years we’ve expanded our programs across the United States, and so our need to observe our application systems has grown too.

Product Explainer Video: Splunk Infrastructure Monitoring for Real-time Monitoring in the Cloud

Wherever you are in your cloud journey and whatever your environment looks like, Splunk Infrastructure Monitoring is a purpose-built metrics platform to address real-time cloud monitoring requirements at scale. Get real-time observability for data from any cloud, any vendor, and any service.