Observability for Developers | Splunk
IAmDevloper and Splunk's EMEA Director of Product Marketing, Observability, and IT Markets discuss how observability is impacting customers and businesses.


The latest News and Information on Monitoring for Websites, Applications, APIs, Infrastructure, and other technologies.
Written by Liz Fong-Jones and Phillip Carter. OpenTelemetry, also known as OTel, is a CNCF open standard that enables distributed tracing and metrics collection from your applications. At Honeycomb, we believe that OpenTelemetry is the best way to ingest the high-cardinality and high-dimensional data that every system, no matter how complex or distributed, needs for observability.
When IT budgets are tight—and they almost always are—pressure comes down to cut costs, streamline technology stacks, and overall do more with less. And when a recession hits, you’re going to see your budget get slashed—unless you can transform your IT department from a cost center to a strategic partner in recession planning and cost efficiency.
Stable network connections are your business’s lifeline. Vital elements of your modern workplace—such as hybrid working, SaaS application usage, and online collaboration—depend on good network performance, contributing to employee productivity and satisfaction. But when network problems started to escalate for one of our customers, they realized they needed to look beyond their traditional network performance monitoring tools to solve the issue.
Kubernetes has become the de facto standard for cloud-based applications. As companies migrate more and more workloads, ensuring reliable connectivity and performance are critical not just for user applications but also for the cluster itself. In this article, we will discuss how augmenting your system monitoring with in-cluster synthetic testing can give you proactive indicators that something might be headed for trouble.
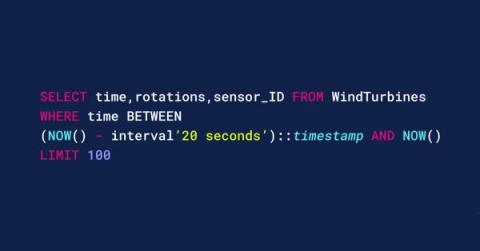
One of the significant features announced with InfluxDB IOx is native SQL support. Even if SQL isn’t the lingua franca of the computing world, there are no doubt those that could make a case for it. There seems to be some dialect of SQL in virtually every corner of the internet.
The best part of my job is talking to you, our prospects, and customers, about your logging and data practices. I love listening to what you are doing and hope to accomplish, so I can get a sense of the end state. My goal is to brainstorm solutions that provide overall value across the enterprise, and not just aim for a narrow tactical win with limited impact. In late September, I hung out at a local DevOps conference in Brooklyn with the NYC Cribl sales team.
October has, as usual, been a busy month, and Sysdig announced many new features. In Sysdig Monitor, we announced the release of four new Advisories and Yaml config support for Advisor. In Sysdig Secure, we released Severity filtering in Insights, Pod and Node activity view in Insight and four new Falco rules added to the Rules Library. Each of these are discussed in detail below.
For several decades, IT monitoring has been deployed in different forms. The focus of IT monitoring has been to gather metrics about the operations of an IT infrastructure’s hardware and software assets to ensure that all the key functions are being performed as expected to support applications and IT services. In the recent past, the term Observability has been used as a synonym for “modern monitoring”.