Operations | Monitoring | ITSM | DevOps | Cloud

Sponsored Post

Microsoft 365 Monitoring for MSPs: Why the Admin Center Isn't Enough

Managed Service Providers are responsible for an increasing proportion of their customers' cloud infrastructure. For many MSPs, Microsoft 365 has become one of the most important parts of that responsibility. Email, Teams, SharePoint, OneDrive, Entra ID, Intune and Microsoft 365 licensing can all sit within the same customer environment. Add security configuration, Microsoft Secure Score and user lifecycle management, and there is a considerable amount for an MSP to monitor.

SAP Basis Automation: A Practitioner's Guide to 5 Scenarios and ROI

Automating SAP Basis tasks means trading manual, repetitive administration work for scheduled or event-driven workflows. These workflows typically include automated health checks, job monitoring and recovery, system refresh post-processing, and patch validation. This guide covers five things worth automating: four recurring operational tasks that return hours back to your team, plus a fifth layer, AI-driven diagnosis, that sits on top of all four and catches what routine automation can’t.

Azure Monitor for AVD: Gaps, Limitations & Fixes

Microsoft Azure Monitor is an essential platform service for monitoring Azure resources. It provides valuable telemetry, logs, metrics, and alerts that help administrators understand the health of their cloud infrastructure. For organizations running Azure Virtual Desktop (AVD), Azure Monitor is usually the first monitoring service they deploy.

Don't Sleep on Perplexity

Perplexity was a big name a few years ago. But, we haven’t heard much out of them lately. There are plenty of posts on social media criticizing Perplexity to that effect. One thing that the posts miss is that Perplexity is still the king of AI search. Google is giving it a run for its money with the AI previews on Google search, but Perplexity still wins out in several measurable ways.

Task containers turn idle jobs into on-demand compute

Somewhere in most production setups there is a container that stays awake all week to do one job on Friday. Maybe it re-indexes a database. Maybe it runs a batch report, or a data migration that only matters at month end. Either way, the resources are billed for seven days. Task containers close that gap. They are ephemeral, API-triggered containers that spin up inside an Upsun Cloud environment, run exactly one command, and remove themselves when that command exits. Nothing sits idle between runs.

How to Analyze Your Network Performance: Reading Obkio's Network Monitoring Session Page

Every pair of Monitoring Agents in your Obkio account create a Network Monitoring Session to monitor network performance between the two agents. Every one of those monitoring sessions comes with its own dedicated page, automatically. You'll find it under the Network Performance tab: click into it, pick a network monitoring session from the list, and the full page loads for that specific connection.

Log Parsing: How Raw Logs Become Searchable Fields

A log file full of raw text is close to useless when an incident is running. You can grep it. What you cannot do is ask how many failed logins came from one address in the last ten minutes. That is usually the question in front of you. Log parsing closes that gap, and a log parser is the software that does the work. In this blog, you will see: Log parsing is the process of reading a raw log line and extracting its values into named, structured fields.

Top 9 AIOps Tools to Cut Alert Noise and Speed Up Root Cause Analysis

During your last major outage, several monitoring tools raised alerts and every one of them was correct. What none of them could say was which alert explained the others, so the opening stretch of the incident went on assembling a picture the systems already held between them. That time shows up in your availability numbers, your SLA credits, and your board report. AIOps platforms close that gap by grouping the alerts caused by the same failure and handing your team one incident with context attached.

Shift Scheduling: 10 Signs You've Outgrown Spreadsheets (And What to Look for Next)

It’s Friday afternoon. Two employees have requested time off. Someone calls in sick. Another wants to swap shifts. Then you realize the only certified technician scheduled for the night shift is also marked as being on vacation. What looked like a perfectly organized spreadsheet this morning can quickly turn into a puzzle. As organizations grow, scheduling gets more complex.

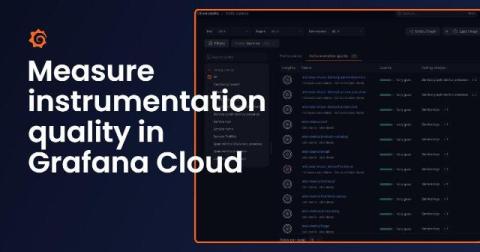
How to measure and improve instrumentation quality for better full-stack observability

Modern engineering teams instrument everything, with metrics, logs, traces, and profiles flowing from hundreds of services at once. But full-stack observability isn’t really about collecting more telemetry; it's about having a single, unified picture of how your services connect to every layer beneath them, including their dependencies, the pods and nodes they run on, and the logs, traces, and profiles that explain their behavior.