Operations | Monitoring | ITSM | DevOps | Cloud

How balancing technology and people can elevate employee satisfaction

The pandemic has forever changed the workplace, especially for my support and product success team at ServiceNow. One thing that hasn’t changed is our commitment to operational excellence, which starts with a great employee experience. My goal is to improve employee satisfaction for our technical support engineers (TSEs). If our TSEs are satisfied, then our customers reap the benefits. When TSEs feel valued and appreciated, they build greater trust with customers.

Checkly Completes SOC 2 Type 1 Audit

A Service Organization Control (SOC) audit is one of the most extensive tests an organization can undergo to demonstrate the ongoing maintenance of high-level information security. Today, we’re thrilled to announce that Checkly is SOC 2 Type 1 compliant after completing a successful audit by an accredited auditing firm. This demonstrates that Checkly’s information security policies, procedures, and practices meet the SOC 2 guidelines for security and data privacy.

Time Series Forecasting with Python and Facebook Kats

Time series analysis is the study of a sequence of data points and records that are collected over a constant period. The analysis indicates how a variable or a group of variables has changed and helps in discovering underlying trends and patterns. Time series data is generally used for forecasting problems by predicting the likelihood of future data based on historical information.

Logging From Mobile Devices Using Cribl.Cloud

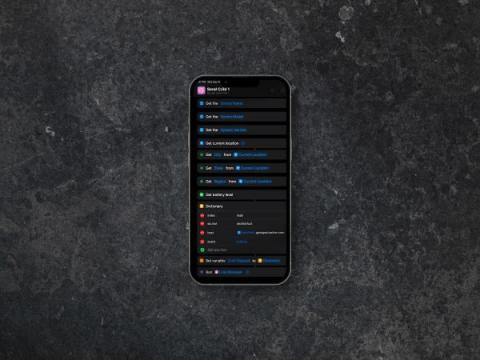
Mobile devices have changed our world. They come with us everywhere and provide invaluable services. One nagging problem is how to get data out of your mobile device. Specifically, logging metrics and events can be a trial. Opening up a public-facing port, managing the log receivers, coding… Wouldn’t it be nice if this was simplified? This article will demonstrate how easy delivering logs can be using Cribl.Cloud and simple HTTP POSTs – for free.

Feature update: Interface Topo and Saved Maps landing page

At LogicMonitor, we build with the customer in mind. We continue to iterate on the design and development of our platform to deliver a modern and intelligent customer experience. With that in mind, did you catch the important announcement in the Looking Ahead section of the v.175 Release Notes? The note announced that “LogicMonitor is in the process of rolling out a new user experience (UX) for customer portals.

Observability Pipelines: Helping Your Data Do More

With an exploding volume of data and systems comes the need for observability, or the ability to understand the internal states of a system from knowledge of its external outputs. As a result, observability data's importance is at an all-time high. Businesses spanning every industry use it in various ways to respond to issues, increase agility, mitigate risk, and ultimately provide better experiences for their users. It’s an incredibly valuable commodity.

Datadog alternatives for cloud security and application monitoring

If you work in IT or DevOps, unless you’ve been living on a remote island without Internet access, you’ve likely heard of Datadog, a popular platform for monitoring cloud applications. Datadog collects and interprets data from various IT resources. The resulting insights assist in managing performance and reliability challenges to deliver a better end-user experience.

How to monitor DNS query response time

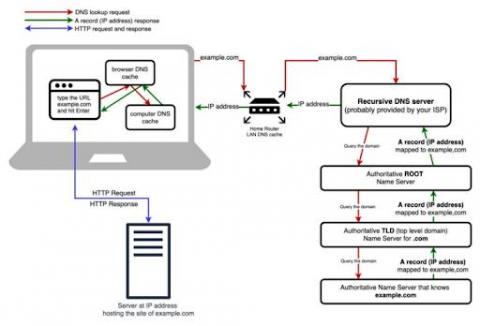
DNS (Domain Name System) servers translate standard language web addresses to their actual IP addresses for network access. DNS response time is the time it takes a Domain Name Server to receive the request for a domain name’s IP address, process it, and return the IP address to the browser or application requesting it. When it comes to DNS response times, the lower the better, and generally values less than 100ms are considered to be in the acceptable range (depending on the application).